Multi Pivot (S/R) & Previous Period (OHLC)█ Multi Pivot (Support/Resistance) & Previous Period (Open/High/Low/Close)
The previous script was deleted because of a copyrighted word.
From JayRogers description.
█ Multi Pivot Selector
Allows you to set up to 3 distinct sets of pivots, each with their own resolution settings and the ability to select how many support|resistance levels are shown.
The maximum amount of S|R levels available varies with different pivot types, the options available are:
Traditional
Fibonacci
Woodie
Classic
Copyrighted word
Camarilla
Fibonacci Extended
█ Previous Period Levels
A simple but highly customisable display of previous higher time-frame OHLC values.
Customised resolution input which excludes time frames lower than 1 hour while extending the common higher reference inputs.
This script is based on JayRogers script, I only added some features so please check out his script.
I added the timeframe in the labels, in order to make it easier to differentiate when using multiple pivot set.
As well as making it possible to change the lines color of each pivot set separately.
Labels can now be displayed on each side (right, left and both) or just disabled.
The type of pivot can be shown on the right side.
Lines extension can be disabled and lines width value can be changed.
I also added another one of his script to display OHLC levels, I made similar changes.
Converted to Pine Script v5.
Previous Period Levels - X Alerts
Pivotal - Multi Pivot Selector (which was also deleted because of the copyrighted word)
"pivot"に関するスクリプトを検索

Central Pivot Ranges & Pivot based BarcolorsThe Central Pivot Range derived from the pivot of a defined higher timeframe is the considered by some traders as the bread and butter levels of the market for a reason.
A combination of 3 CPRs from different timeframes can provide you with some some more insight into the assets your analysing and might offers you some more confidence in performing your trades.
This script also offers you an extensive amount of options like:
- The option to look at current or developing CPRs.
- A resolution selector
- Options to hide and show Tops Bottoms and Pivots seperately
- Color selectors depending on the close price up or down the pivots
- And an option to colorize your candles by pivots crossed.

The Golden PivotsThe Golden Pivots indicator is a combination of the following:
1. Central Pivot Range
2. Floor Pivots
3. Camarilla Pivots
4. Monthly, Weekly, Daily Highs and lows
5. Candlestick Setups
All the pivot calculations are based on Secret of Pivot Boss book by Frank Ochoa.
One can also view tomorrow's central pivot range by today end of the day.

Pivot High Low Pointsby using this script you can find Pivot High-Low Points. This script works like Tradingview pivothigh & pivotlow functions.
If you find my works useful, please consider a donation
BTC: 16XRqyS3Vgh1knAU1tCcruqhUrVm4QWWmR
by LonesomeTheBlue

Combined MTF Camarilla Pivots (HA + Candles)This is a fairly basic (but hopefully useful) indicator that combines three time-frames of Camarilla pivots into one.
Default time-frames are:
Weekly
Monthly
Yearly
Time-frames can be modified as you wish, they are just set to these as I generally only trade higher intervals (just note that formatting labels will not change - but you can update these as needed).
The Camarilla pivots displayed are as follows:
R3, R4, R5, R6
Pivot line (Middle/Base)
S3, S4, S5, S6
R1/S1 & R2/S2 are excluded to make way for R5/S5 & R6/S6 - as these are more useful for the majority of traders. The formula for levels 5/6 are always up for debate, as no official formula has ever been released. I've used what I consider a mid, or consensus calculation.
By default all historical pivot levels are displayed, as there can be some benefit to mapping these forward once the relevant period has ended. If people find it's too cluttered I'll look into having an option to display the current period only.
Unfortunately, TradingView doesn't allow labels on plots (seems like such a basic feature to be missing, but there you go), so you'll have to learn the colours/linewidths.
Oh, and there's a checkbox to enable pivots to be calculated on Heiken-Ashi prices/candles rather than default prices/candles. This heavily modifies the location of the Camarilla Pivots, but I've found that in certain situations you can get some great results.
Let me know your thoughts/comments/suggestions.
Cheers
DD

Floor Trader PivotsGenerated by: Claude Sonnet 4.5
Pine Script that draws Floor Trader Pivots using 'daily' price levels with configurable options.
Key Features:
Pivot Calculation: Uses the classic formula: Pivot = (High + Low + Close) / 3
Resistance levels: R1, R2, R3
Support levels: S1, S2, S3
Optional mid-pivots between main levels
Configurable Settings:
Timeframe: Choose Daily, Weekly, or Monthly pivots
Display toggles: Show/hide individual levels
Colors: Customize each level's color
Line style: Solid, dashed, or dotted
Line width: 1-5 pixels
Extension: None, right, or both directions
Labels: Show/hide with left or right positioning
Calculations:
R1 = 2×Pivot - Low
R2 = Pivot + (High - Low)
R3 = R1 + (High - Low)
S1 = 2×Pivot - High
S2 = Pivot - (High - Low)
S3 = S1 - (High - Low)
Uses daily price levels specifically.
Added daily-specific data fetching: The script now explicitly fetches both current day and previous day's high, low, and close prices
Calculations use daily data: All pivot calculations now use prevDailyH, prevDailyL, and prevDailyC (previous day's high, low, close)
Kept the timeframe input: You can still change it if you want weekly or monthly pivots, but it now defaults to and emphasizes daily calculations
The Floor Trader Pivots will now always be based on the previous day's price action, which is the traditional method floor traders use. This is particularly useful for intraday trading as these levels update daily and provide key support/resistance zones.

Bijnor Pivot ExtendedOverview: The Bijnor Pivot Extended (BP+) indicator is a powerful visual tool designed to help traders identify key price levels using Fibonacci-based pivots. It dynamically plots Support and Resistance levels based on your chosen timeframe (Daily, Weekly, or Monthly) and displays them only for the current session, reducing chart clutter and improving focus.
🔧 Features:
📆 Pivot Timeframe Selection: Choose between Daily, Weekly, or Monthly pivots.
🎯 Fibonacci Pivot Levels:
Central Pivot (P)
Resistance: R1, R2, R3, R4 (Extended)
Support: S1, S2, S3, S4 (Extended)
🎨 Full Customization:
Toggle labels and prices on/off
Position labels to the left or right
Change line width and individual colors for pivot, support, and resistance lines
🧠 Smart Line Plotting:
Lines are drawn only during the selected session, keeping your chart clean
🕹️ Max Performance: Optimized to stay lightweight with max_lines_count and max_labels_count set to 500
🧭 How to Use It:
Use this indicator to:
Plan entries and exits around key Fibonacci pivot zones
Identify overbought/oversold zones at R3/R4 and S3/S4
Enhance your intraday, swing, or positional trading setups
Combine with price action, candlestick patterns, or volume for maximum edge.
✅ Bonus:
This script is ideal for traders looking for a minimalist yet powerful pivot framework, with extended levels for breakout or reversal scenarios.
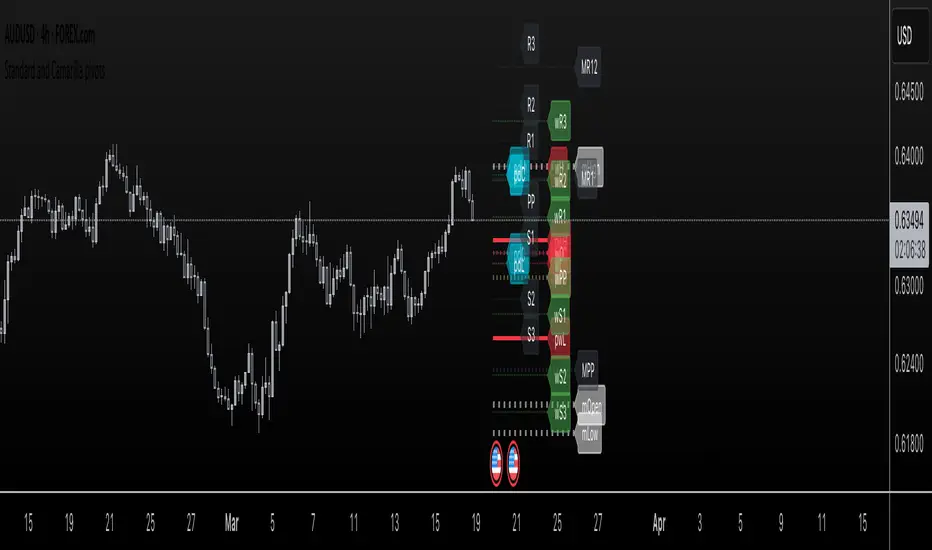
Standard and Camarilla pivotsHi guys, I would like too introduce to all of you my script. As the name already tell you what this script is all about. It's about pivot points.
You may ask, Tradingview already have a script for pivot points, why would I need another script?
here is the answer: This script allow you to add more than one type of pivot, sounds good right?
But there's more: You can see not just one timeframe pivots, you can see many timeframe pivots, nice huh?
let dive into it to know a bit more.
In this script you can see daily pivots include Standard pivots as R1, R2, R3 and Camarilla pivots as cR1, cR2, cR3, and I you different color for different pivots, so you don't confuse between those two.
You can see weekly pivots the same as daily pivots only has letter "w" in front of it, for examples: "wR1, wR2, wcR1, wcR2" ,nice right?
What's about month level: yes, you can see monthly pivots too, and it start with "m".
Along with pivots points above, you also can see daily open, previous day close, previous high,.., for instances: daily open as "O", previous day open as "PDO",
You are able to see previous week level, previous month levels.
have fun.
I dont wanna lock this script because open-source script help me learn how to code pine script, so that's why I keep it open. Thank to all the coders out there that shared everything they have for us to learn.
Pivot Points Level [TradingFinder] 4 Methods + Reversal lines🔵 Introduction
"Pivot Points" are places on the price chart where buyers and sellers are most active. Pivot points are calculated based on the previous day's price data and serve as reference points for traders to make decisions.
Types of Pivot Points :
Floor
Woodie
Camarilla
Fibonacci
🟣 Floor Pivot Points
Floor pivot points are widely used in technical analysis. The central pivot point (PP) serves as the main level of support or resistance, indicating the potential direction of the trend.
The first to third levels of resistance (R1, R2, R3) and support (S1, S2, S3) provide additional signals for potential trend reversals or continuations.
Floor Pivot Points Formula :
Pivot Point (PP): (H + L + C) / 3
First Resistance (R1): (2 * P) - L
Second Resistance (R2): P + H - L
Third Resistance (R3): H + 2 * (P - L)
First Support (S1): (2 * P) - H
Second Support (S2): P - H + L
Third Support (S3): L - 2 * (H - P)
🟣 Camarilla Pivot Points
Camarilla pivot points include eight levels that closely align with support and resistance. These points are particularly useful for setting stop-loss and profit targets.
Camarilla Pivot Points Formula :
Fourth Resistance (R4): (H - L) * 1.1 / 2 + C
Third Resistance (R3): (H - L) * 1.1 / 4 + C
Second Resistance (R2): (H - L) * 1.1 / 6 + C
First Resistance (R1): (H - L) * 1.1 / 12 + C
First Support (S1): C - (H - L) * 1.1 / 12
Second Support (S2): C - (H - L) * 1.1 / 6
Third Support (S3): C - (H - L) * 1.1 / 4
Fourth Support (S4): C - (H - L) * 1.1 / 2
🟣 Woodie Pivot Points
Woodie pivot points are similar to floor pivot points but place more emphasis on the closing price. This method often results in different pivot levels than the floor method.
Woodie Pivot Points Formula :
Pivot Point (PP): (H + L + 2 * C) / 4
First Resistance (R1): (2 * P) - L
Second Resistance (R2): P + H - L
First Support (S1): (2 * P) - H
Second Support (S2): P - H + L
🟣 Fibonacci Pivot Points
Fibonacci pivot points use the standard floor pivot points and then apply Fibonacci retracement levels to the range of the previous trading period. The common retracement levels used are 38.2%, 61.8%, and 100%.
Fibonacci Pivot Points Formula :
Pivot Point (PP): (H + L + C) / 3
Third Resistance (R3): PP + ((H - L) * 1.000)
Second Resistance (R2): PP + ((H - L) * 0.618)
First Resistance (R1): PP + ((H - L) * 0.382)
First Support (S1): PP - ((H - L) * 0.382)
Second Support (S2): PP - ((H - L) * 0.618)
Third Support (S3): PP - ((H - L) * 1.000)
These pivot point calculations help traders identify potential support and resistance levels, enabling more informed decision-making in their trading strategies.
🔵 How to Use
🟣 Two Methods for Trading Pivot Points
There are two primary methods for trading pivot points: trading with "pivot point breakouts" and trading with "price reversals."
🟣 Pivot Point Breakout
A breakout through pivot lines provides a significant signal to the trader, indicating a change in market sentiment. When an upward breakout occurs and the price crosses these lines, a trader can enter a long position and place their stop-loss below the pivot point (P).
Similarly, if a downward breakout happens, a short order can be placed below the pivot point.
When trading with pivot point breakouts, if the upward trend breaks, the first and second support levels can be the trader's profit targets. In a downward trend, the first and second resistance levels will serve this role.
🟣 Price Reversal
Another method for trading pivot points is waiting for the price to reverse from the support and resistance levels. To execute this strategy, one should trade in the opposite direction of the trend as the price reverses from the pivot point.
It's worth noting that although traders use this tool in higher time frames, it yields better results in shorter time frames such as one-hour, 30-minute, and 15-minute intervals.

Daily Pivots with Fakeout Protection█ OVERVIEW
The "Daily Pivots with Fakeout Protection" indicator is a powerful tool designed to help traders identify potential price breakouts and pivot levels on daily charts. This indicator calculates and displays daily pivot points along with breakout lines that are adjusted to provide a certain level of protection against fakeouts, which are false price movements that can mislead traders.
█ FEATURES
• Pivot Timeframe Selection: You can choose the timeframe for the pivot calculations. The default is set to daily (D), but you have the flexibility to select other timeframes as well.
• Fakeout Protection: A percentage-based parameter allows you to define the amount of protection you want against fakeouts. This helps filter out potentially unreliable breakouts.
• Bullish and Bearish Signals: The indicator distinguishes between bullish and bearish conditions by comparing the closing price to the daily high and low.
• Breakout Signals: Triangular symbols (upward and downward) appear below and above bars to signal potential breakout points. These are based on the closing price crossing the adjusted breakout lines.
• Visual Representation: Pivot points, daily high, and daily low are plotted on the chart, with distinctive line styles and colors for easy identification.
• Background Highlighting: The background color of the chart changes when a new period begins, helping you quickly recognize the start of a new trading day.
• Color-Coded Zones: The indicator colors the background around the closing price differently based on whether the market is bullish (green) or bearish (red).
█ HOW TO USE
1 — Apply the "Daily Pivots with Fakeout Protection" indicator to your TradingView chart.
2 — Customize the parameters like pivot timeframe and fakeout protection percentage according to your trading preferences.
3 — Watch for the triangular breakout symbols that appear above and below bars, indicating potential breakout points.
4 — Keep an eye on the pivot points, daily high, and daily low lines to understand price levels relevant to the current trading day.
5 — Use the background color changes to quickly identify the beginning of a new trading day and any potential shifts in market sentiment.
Note:
• This indicator is designed for daily charts but can be adjusted to work with other timeframes as well.
• Be cautious of relying solely on breakout signals; consider using additional technical and fundamental analysis for confirmation.
Start integrating the "Daily Pivots with Fakeout Protection" indicator into your trading strategy to enhance your ability to identify breakouts and pivot levels more effectively.

Price Pivots for NASDQ 100 StocksPrice Pivots for NASDQ 100 Stocks
What is this Indicator?
• This indicator calculates the price range a Stock can move in a Day.
Advantages of this Indicator
• This is a Leading indicator, not Dynamic or Repaint.
• Helps to identify the tight range of price movement.
• Can easily identify the Options strike price.
• Develops a discipline in placing Targets.
Disadvantages of this Indicator
• The indicator is specifically made for NASDQ 100 stocks. The levels won't work for other stocks.
• The indicator shows nothing for other indexes and stocks other than above mentioned.
• The data need to be entered manually.
Who to use?
Highly beneficial for Day Traders, it can be used for Swing and Positions as well.
What timeframe to use?
• Any timeframe.
• The highlighted levels in Red and Green will not show correct levels in 1 minute timeframe.
• 5min is recommended for Day Traders.
When to use?
• Wait for proper swing to form.
• Recommended to avoid 1st 1 hour or market open, that is 9.15am to 10.15 or 10.30am.
• Within this time a proper swing will be formed.
What are the Lines?
• The concept is the price will move from one pivot to another.
• Entry and Exit can be these levels as Reversal or Retracement.
Gray Lines:
• Every lines with price labels are the Strike Prices in the Option Chain.
• Price moves from 1 Strike Price level to another.
• The dashed lines are average levels of 2 Strike Prices.
Red & Green Lines:
• The Red and Green Lines will appear only after the first 1 hour.
• The levels are calculated based on the 1st 1 hour.
• Red Lines are important Resistance levels, these are strong Bearish reversal points. It is also a breakout level, this need to be figured out from the past levels, trend, percentage change and consolidation.
• Green Lines are important Support levels, these are strong Bullish reversal points. It is also a breakdown level, this need to be figured out from the past levels, trend, percentage change and consolidation.
What are the Labels?
• First Number: Price of that level.
• Numbers in (): Percentage change and Change of price from LTP (Last Traded Price) to that Level.
How to use?
Entry:
• Enter when price is closer to the Red or Green lines.
• Enter after considering previous Swing and Trend.
• Note the 50% of previous Swing.
• Enter Short when price reverse from each level.
• If 50% of swing and the pivot level is closer it can be a good entry.
Exit:
• Use the logic of Entry, each level can be a target.
• Exit when price is closer to the Red or Green lines.
Indicator Menu
Source
• Custom: Enter the price manually after choosing the Source as Custom to show the Pivots at that price.
• LTP: Pivot is calculated based on Last Traded Price.
• Day Open: Pivot is calculated based on current day opening price.
• PD Close: Pivot is calculated based on previous day closing price.
• PD HL2: Pivot is calculated based on previous day average of High and Low.
• PD HLC3: Pivot is calculated based on previous day average of High, Low and Close.
"Time (Vertical Lines)"
• This is a marker of every 1 hour.
• Usually major price movement happen between previous day last 1 hour to today first 1 hour.
• Two swings can happen between first 2 hour of current day.
• At the end of the day last 1 hour another important movement will happen.
• Usually rest of the time won't show any interesting movement.
To the Users
• Certain symbols may show the levels as a single line. For such symbols choose a different Source or Timeframe from the indicator menu.
• Please inform if any of the Symbol's price levels don't react to the pivots , include the Symbol a well.
• Also inform if you notice any wrong values, errors or abnormal behavior in the indicator.
• Feel free to suggest or adding new features and options.
General Tips
• It is good if Stock trend is same as that of Index trend.
• Lots of indicators creates lots of confusion.
• Keep the chart simple and clean.
• Buy Low and Sell High.
• Master averages or 50%.
• Previous Swing High and Swing Low are crucial.
Important Note
• Currently the levels are in testing stage.
• Eventually the levels of certain symbols will be corrected after each update and test.

Waddah Attar Weekly Camarilla Pivots [Loxx]Waddah Attar Weekly Camarilla Pivots is an indicator built by Ahmad Waddah Attar that draws weekly Camarilla over lower timeframes.
What are Camarilla pivots?
Camarilla Pivot Points is a math-based price action analysis tool that generates potential intraday support and resistance levels. Similar to classic pivot points, it uses the previous day's high price, low price, and closing price.
Camarilla Pivot Points is a modified version of the classic Pivot Point. Camarilla Pivot Points were introduced in 1989 by Nick Scott, a successful bond trader. The basic idea behind Camarilla Pivot Points is that price has a tendency to revert to its mean until it doesn’t. What makes it different than the classic pivot point formula is the use of Fibonacci numbers in its calculation of pivot levels. Camarilla Pivot Points is a math-based price action analysis tool that generates potential intraday support and resistance levels.
Details
-Used for intraday trading to identify support/resistance levels
-Restricted to timeframes 4 hours and below
-Unlike most versions of Weekly Camarilla Pivots, this version allows you to customize the Fibonacci levels

Volume Profile, Pivot Anchored by DGTVolume Profile (also known as Price by Volume ) is an charting study that displays trading activity over a specified time period at specific price levels. It is plotted as a horizontal histogram on the finacial isntrumnet's chart that highlights the trader's interest at specific price levels. Specified time period with Pivots Anchored Volume Profile is determined by the Pivot Levels, where the Pivot Points High Low indicator is used and presented with this Custom indicator
Finally, Volume Weighted Colored Bars indicator is presneted with the study
Different perspective of Volume Profile applications;
Anchored to Session, Week, Month etc : Anchored-Volume-Profile
Custom Range, Interactive : Volume-Profile-Custom-Range
Fixed Range with Volume Indicator : Volume-Profile-Fixed-Range
Combined with Support and Resistance Indicator : Price-Action-Support-Resistance and Volume-Profile
Combined with Supply and Demand Zones, Interactive : Supply-Demand-and-Equilibrium-Zones
Disclaimer : Trading success is all about following your trading strategy and the indicators should fit within your trading strategy, and not to be traded upon solely
The script is for informational and educational purposes only. Use of the script does not constitutes professional and/or financial advice. You alone the sole responsibility of evaluating the script output and risks associated with the use of the script. In exchange for using the script, you agree not to hold dgtrd TradingView user liable for any possible claim for damages arising from any decision you make based on use of the script

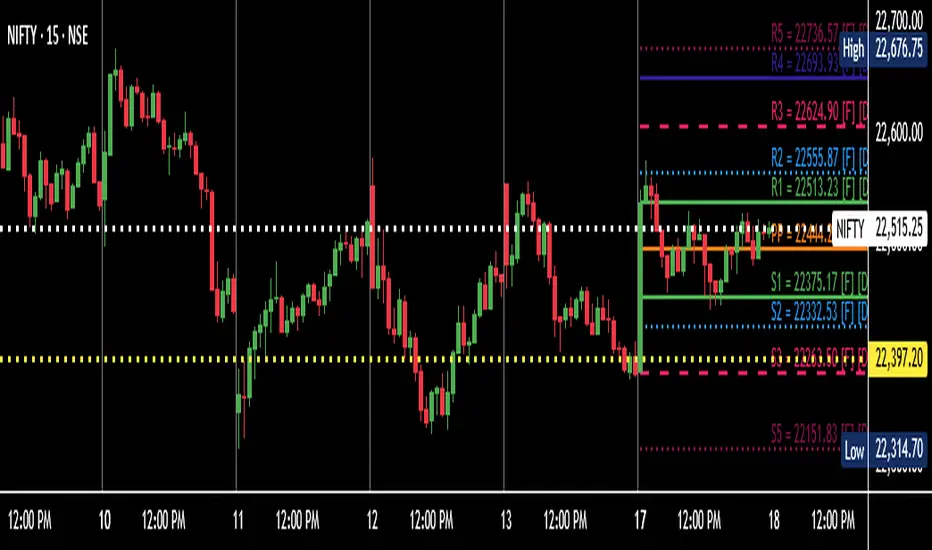
Daily Pivot (Fibonacci)Hello All
-
This is Daily Pivot (Fibonacci).
Simple and very useful tool for traders.
Show R5 to S5 levels.
.
Feel free to comment.
Thank you.
Camerilla PivotsBefore starting special thanks to @QuantNomad for his script "Ultimate Pivot Point Alerts"
Link : -
Please follow and support him for his work.
In this script I'm modifying how time frame factor is imported into the script and removing other types of Pivots and cleaning it further for only CAMs, I've also added the formulas for 5 and 6 numbers, it will help in trading breakout strategies.
Note that this way of importing Time frame produces minor difference in readings/levels from how it is done in QuantNomads script, so before taking your pics you should calculate your levels on separate sheet and compare which ones are working for you and your strategy.
I've been using this CAM setup for almost a year now, so I coded it as per my needs, it is up to users to utilize it to theirs.
Further utility:
1. You can hide/unhide S/R levels 5/6
2. This is MultiTimeframe version, meaning you can change Time-frame of Pivots being displayed on any TF chart.
3. Lines are produced for only level 3 and 4. And you can choose to hide them. Only Pivot line is kept and can not be hidden.
4. You can also choose to hide/unhide level value and only see label if you want.
5. No historical levels are kept to avoid clutter.
I've not included alerts as I don't use them, but if anyone wants it I suggest referring to @QuantNomad script bank. He has published number of excellent scripts in this regard.
There is no restrictions on this script, it can be used and reproduced freely. Its my way of doing little something for community and my first script.
Enjoy.


Manual Pivot Plotter//================================================================================
//📌 Manual Pivot Plotter (P, R1–R3, S1–S3)
//📈 Pine Script v6
//
//This script allows the user to manually input Pivot levels (P), Resistance levels
//(R1, R2, R3), and Support levels (S1, S2, S3). Each line starts at the beginning
//of the new trading day (detected at 00:00 UTC+8) and extends only a limited
//distance into the future (default: 3 bars).
//
//Features:
//✔ Manual pivot, support, and resistance level inputs
//✔ Lines refresh automatically at each new day (00:00 UTC+8)
//✔ Lines extend only a few bars ahead (not full chart)
//✔ Clean label placement slightly below line and near line end
//✔ No repainting, memory-safe line handling
//✔ Smooth intraday updates when values are edited
//
//This tool is ideal for traders who manually calculate or import pivot levels and
//prefer clean, minimal, non-intrusive visual levels on the chart.
//================================================================================

Rolling Pivot RibbonRolling Pivot Ribbon
This indicator displays historical and developing pivot levels across multiple days,
creating a dynamic "ribbon" effect as pivots roll forward through time.
DESIGNED FOR: Intraday timeframes (≤1D). Shows warning on higher timeframes.
USE CASE: Identify key support/resistance levels, track pivot evolution, and spot
price interaction zones with enhanced visual clarity.
WHY?
There comes a time in every Pinescript developer's evolution, they feel compelled to write a script that draws many lines, possibly triangles, into the future. This is mine. It's both totally useless, and a constant source of comfort to me.
KEY FEATURES:
• Multiple pivot calculation methods (Classic, Camarilla)
• Historical pivot tracking with configurable lookback period (default 4 days)
• Real-time "developing" pivots that update intraday based on current day's HLC
• Gradient fills between adjacent pivot levels for visual depth
• 13 pivot levels: PP, R1-R6, S1-S6
TASTY MODE (Advanced):
• Intelligent filtering: only shows lines that price has recently intersected
• Dynamic transparency: opacity adjusts based on intersection frequency
• Auto-cleanup: removes stale lines that haven't been touched in X days
• Smart extensions: lines that see more action project further into the future
• Focus mode options to reduce chart clutter
VISUAL CONTROLS:
• Toggle individual pivot levels on/off
• Customizable colors and transparency for lines and fills
• Flexible label positioning (left-align or right-align)
• Adjustable projection length for pivot lines (defaults to 1. Set to 0 for just a ribbon)

Central Pivot Ranges (CPR) & 3 x VWAP & BarcolorsThis Script Combines daily, weekly and monthly VWAP (Volume Weighted Average Price) with a intraday, daily, weekly and monthly CPR (Central Pivot Range) - which is considered by some traders as the bread and butter of the market for a reason. A combination of Multiple CPRs and VWAPs from different timeframes can provide you with interesting confluences that can give you more confidence in performing your trades.
CPR Features:
- The option to look at current or developing CPRs.
- A resolution selector for all 4 CPRs
- Options to hide and show Tops, Bottoms and Pivots separately
- Various Styling options
- Alerts
VWAP Features:
- 3 x preset VWAPs set to daily, weekly and monthly
- VWAP Lines from the daily O&C or H&L
- Previous VWAP for S/R
- Line Styling options
General Features:
- Barcolors by pivots crossed or daily, weekly and monthly VWAP.
- Barcolors by daily VWAP additionally contain an O and C check instead of just taking the price above or below the VWAP into consideration.

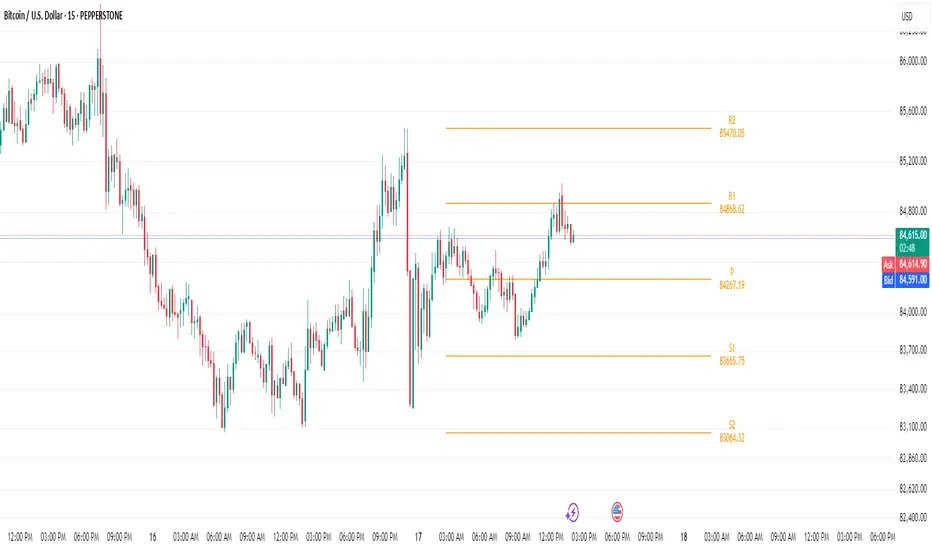
Pivot Point Daily prediction bitcoin - by Simon-RoseThis is an additional Script to my recent Pivot Point indicator scripts which will show you the next days pivot points based on the actual price range.
This is useful if you are trading right before a new day and want to know how the next bdays pivot points may be placed.
If you have any questions or suggestions pls write me :)
Happy trading
Cheers
Daily Pivots:
Weekly Version:
Monthly Version:

Pivot Channel LevelsPivot Channel Levels
Indicator Description
“Pivot Channel Levels” is an advanced technical analysis tool that identifies key price pivots (highs and lows) and creates dynamic support and resistance levels based on the wicks of candles at these points (or bodies if wicks are minimal). The indicator analyzes the volume at the time of a pivot’s formation, displaying its value and percentage change relative to the volume’s simple moving average (SMA).
It does not generate buy/sell signals but provides a clear visualization of market structure, helping traders identify potential price reaction zones and assess the strength of market movements.
Why Are Wicks Important?
Candle wicks at price pivots indicate significant market reactions in key areas. Depending on the context, they may signal rejection, testing, or absorption of a support or resistance level. Long wicks often appear where large players are active, and the marked zones are frequently retested. The indicator allows for quick identification and observation of their impact on future price action.
Why Use It?
- Precise Support and Resistance Levels: The indicator draws price channels based on candle wicks at pivots (or bodies if wicks are absent), enabling better identification of zones where price may react.
- Volume Analysis: It shows how the volume at a pivot differs from the average, indicating potential activity by large players or key market moments.
- Visual Clarity: Colored lines, channel fills, and clear labels facilitate quick chart analysis, even on short timeframes.
- Flexibility: Adjustable pivot length, volume average, and label colors allow customization to various trading strategies.
How It Works
- Pivot Detection: Automatically identifies local highs and lows based on the “Pivot Length” parameter (default: 20 candles). This means a pivot appears on the chart with a 20-candle delay. Reducing this value allows faster pivot detection (after fewer candles), increasing their number but potentially generating more noise.
- Channel Creation: Draws support and resistance levels based on the wicks of candles at pivot points (or bodies if wicks are minimal) with a delay to confirm zones. A pivot channel is drawn until the next pivot is identified, but if not previously broken, it remains valid as active support or resistance.
- Volume Analysis: Displays the volume at the pivot’s formation and its percentage change relative to the volume’s SMA.
- Visualization: Pivot and channel levels are shown as lines with fills, and labels display volume and its deviation from the average.
Trading Applications
- Swing Trading: Use pivot levels and channels to identify price reversal points or consolidation zones.
- Scalping: Monitor price reactions to channels on short timeframes, especially with high volume.
- Faster Pivot Identification: Switch to a lower timeframe (e.g., from H1 to M15) to identify pivots more quickly, allowing earlier reactions to price changes.
- Market Context Analysis: High volume at pivots may indicate significant levels likely to be retested.
- Combining with Other Tools: The indicator pairs well with Fibonacci retracement, supply/demand zones, or oscillators like RSI.
Settings and Customization
- Pivot Length: Determines how many candles back and forward are analyzed to detect pivots (default: 20). A smaller value increases sensitivity, a larger one enhances stability.
- Volume Average: Length of the SMA for volume (default: 20). Adjust to better reflect market characteristics.
- Label Colors: Choose colors for bullish and bearish pivot labels to match your chart style.
Usage Examples
- Identifying Key Zones: If the price approaches a pivot level with high volume (e.g., +50% relative to SMA), it may signal strong support or resistance.
- Breakout Confirmation: A channel breakout with high volume can indicate trend continuation.
- Price Reaction Analysis: Long wicks at pivots with high volume may signal level rejection by large players.
Notes for Users
- The indicator performs best on highly liquid markets (e.g., Forex, indices, cryptocurrencies).
- On short timeframes (e.g., M1, M5), it may generate more noise—adjust “Pivot Length” to suit your needs.
- Consider combining with other indicators to confirm signals derived from pivot and volume analysis.

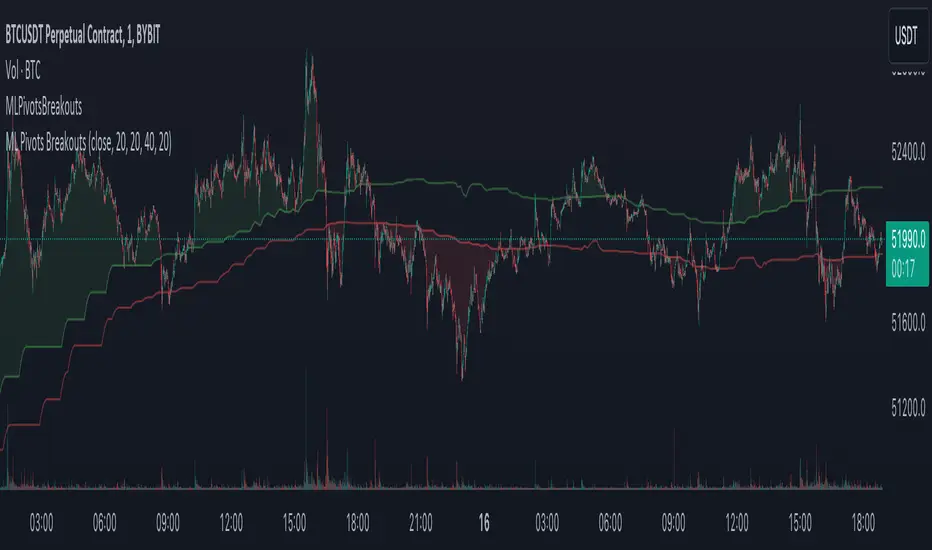
Machine Learning Breakouts (from Pivots)I developed the 'Machine Learning Breakouts (from Pivots)' indicator to revolutionize the way we detect breakout opportunities and follow trend, harnessing the power of pivot points and machine learning. This tool integrates the k-Nearest Neighbors (k-NN) method with the Euclidean distance algorithm, meticulously analyzing pivot points to accurately forecast multiple breakout paths/zones. "ML Pivots Breakouts" is designed to identify and visually alert traders on bullish breakouts above high lines and bearish breakouts below low lines, offering essential insights for breakout and trend follower traders.
For traders, the instruction is clear: a bullish breakout signal is given when the price crosses above the forecasted high line, indicating potential entry points for long positions. Conversely, a bearish breakout signal is provided when the price breaks below the forecasted low line, suggesting opportunities to enter short positions. This makes the indicator a vital asset for navigating through market volatilities and capitalizing on emerging trends, designed for both long and short strategies and adeptly adapting to market shifts.
In this indicator I operate in a two-dimensional space defined by price and time. The choice of Euclidean distance as the preferred method for this analysis hinges on its simplicity and effectiveness in measuring and predicting straight-line distances between points in this space.
The Machine Learning Breakouts (from Pivots) Indicator calculations have been transitioned to the MLPivotsBreakouts library, simplifying the process of integration. Users can now seamlessly incorporate the "breakouts" function into their scripts to conduct detailed momentum analysis with ease.
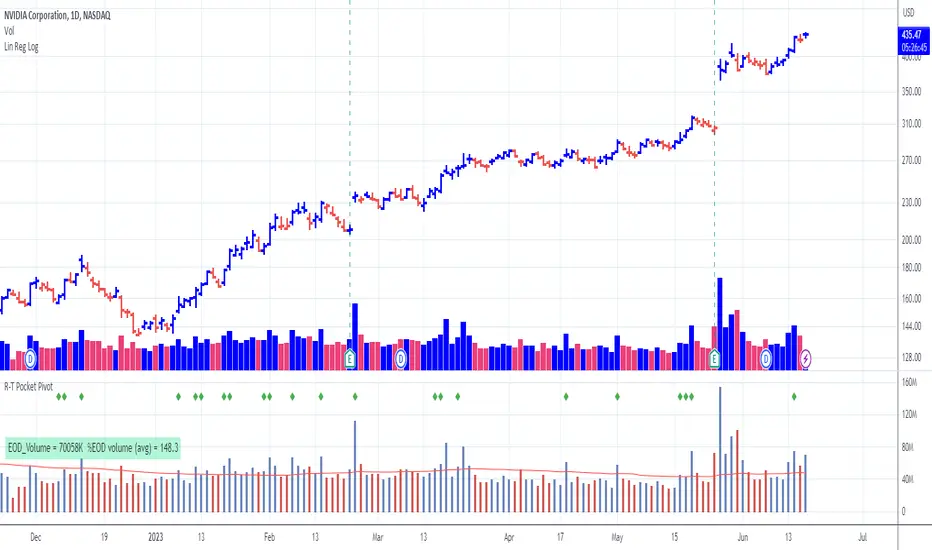
Pocket Pivot with extrapolated Volume and Moving AveragesThe script shows historical pocket pivots, much as other scripts with a green diamond shape on the volume pane.
When the market is open, the current bar, however, is extrapolated to the end of the day using a sixth-order polynomial.
Thus real-time pocket pivots are shown. To work properly, the user must input a time-zone offset parameter; the default is west coast USA.
Time-zone offset is -12 hours to +12 hours compared to the NYSE exchange time zone (USA west coast: -3.)
The volume extrapolation polynomial is based on a historical NASDAQ intraday volume model developed locally by a team.
Only ten-day lookback pocket pivots are computed as defined initially by Dr. Chris Kacher. (The default lookback can be changed by the user.)
Only pocket pivots are shown where the low of the daily bar is within user-defined proximity to the 50-day moving average or 10-day moving average (for continuation pocket pivots.)