Fisher Transform with SignalsFisher Transform with Signals
The Fisher Transform is a technical indicator created by John F. Ehlers that converts prices into a Gaussian normal distribution.1 The indicator highlights when prices have moved to an extreme, based on recent prices. This may help in spotting turning points in the price of an asset. It also helps show the trend and isolate the price waves within a trend.
-The Fisher Transform is a technical indicator that normalizes asset prices, thus making turning points in price clearer.
-Some traders look for extreme readings to signal potential price reversal areas, while others watch for a change in direction of the Fisher Transform.
-The Fisher Transform formula is typically applied to price, but it can also be applied to other indicators.
-Asset prices are not normally distributed, so attempts to normalize prices via an indicator may not always provide reliable signals.
The Fisher Transform enables traders to create a Gaussian normal distribution, which converts data that isn't typically normal distributed, such as market prices. In essence, the transformation makes peak swings relatively rare events to help better identify price reversals on a chart.
This technical indicator is commonly used by traders looking for leading signals, rather than lagging indicators. The Fisher Transform can also be applied to other technical indicators, such as the relative strength index (RSI) or moving average convergence divergence (MACD).
How to Calculate the Fisher Transform
1.Choose a lookback period, such as nine periods. This is how many periods the Fisher Transform is applied to.
2.Convert the prices of these periods to values between -1 and +1 and input for X, completing the calculations within the formula's brackets.
3.Multiply by the natural log.
4.Multiply the result by 0.5.
5.Repeat the calculation as each near period ends, converting the most recent price to a value between -1 and +1 based on the most recent nine-period prices.
6.Calculated values are added/subtracted from the prior calculated value.
How can this script tell us to buy or sell?
- If the fisher is bigger then trigger background will be colored blue and this means you can buy
- If the trigger is bigger then fisher this means you can sell
"signal"に関するスクリプトを検索

ADX Momentum cross + MacD + HH LL + Buy/Sell Signals and alerts Hello, This is the first indicator I have made and would like to contribute to the community.
This strategy came from trying to replicate a previous ADX Cross Indicator that I loved on MT4 which I used successfully on EUR/USD on high and low time frames. Through the process of trying to replicate it I failed, I decided to take what I had written so far and create my own ADX cross strategy using the combination of 3 ADX's, their lag. Then also using Higher highs and lower lows with the MacD to further filter the signals.
There are two buy and two sell conditions , the difference between these are just the order in which the ADX crossing determines the entry. The MacD and higher highs and lower lows are the same for filtering the signal.
You can change the look back for HH and LL look back range, along with the DI Length & ADX Smoothing for all ADX's. The lag used for either the buy or sell strategy with the Lag_Buy/Lag_Sell inputs. Lag_mid setting will affect all 4 conditions.
From testing and based on the ADX cross logic you should follow this structure when changing the inputs for:
DI Length: Lowest DI value (I.E. 1)
DI Lengtha: Middle DI value (I.E. 2)
DI Lengthb: Highest DI value (I.E. 3)
ADX Smoothing: Lowest Smoothing value (I.E. 1)
ADX Smoothinga: Middle Smoothing value (I.E. 2)
ADX Smoothingb: Highest Smoothing value (I.E. 3)
I tested this on the EUR/USD, but mainly I have been using it on BTC/USDT(binance) and BTC/USDT Perpetual futures(binance) with the 5 minute chart. I suggest playing around with the settings depending on the Symbol and timeframe you use because the default settings are what I last found to be optimal for my self on the 5min BTC/USDT Perpetual futures(binance) chart.
A good starting point I found when using the indicator on other charts is to use the below values:
DI Length: 7
DI Lengtha: 14
DI Lengthb: 21
ADX Smoothing: 7
ADX Smoothinga: 14
ADX Smoothingb: 21
If you have any questions, suggestions, or requests for this indicator feel free contact me. You can either comment on here or Message me
If you like this indicator please like and comment where you found it useful.

Stochastic RSI+Applies signal values to significant changes in momentum and can be used in conjunction with other indicators and analysis to improve trade timing.
Both "Signal Up" and "Signal Down" can be used for alerts.
The magnitude of the signal is the difference between K and D.
(See the code for the logic and implementation.)
Signal Up occurs when momentum is within the band and moving upward.
Signal Down occurs when momentum is within the band and moving downward.
Interpretation Note:
The Stochastic RSI is known for false signals, so it should never be used as a pure buy or sell signal. It is useful as a warning or to help with trade timing.
A good example of this is: If you are bullish on a stock, and the signal is negative (signal down), then it may be wise to not buy until the recent change in momentum has dissipated.

Candlestick Pattern IdentifierMy script builds upon another user-submitted script by rebuilding the logic used to identify candlestick patterns. The logic in my script is a mix of strict and lax guidelines to mitigate false flags and present valid buy and sell signals.
-To use this indicator, simply add it to any chart. It will identify trends on any time frame although the lower you go, the more signals you'll see and the higher probability of those signals being false flags. You can also disable any candlestick patterns that you feel are not as useful.
- This indicator works best with Stocks and also with Forex markets to a lesser extent.
- This indicator works the best on the Daily chart and also works (with varying degrees of success) on any timeframe at or above 1 hour. I've found that this indicator works the best when used in tandem with the Daily and Hourly charts with the Hourly chart being used to determine an entry point while the Daily chart is used for long term trend analysis.

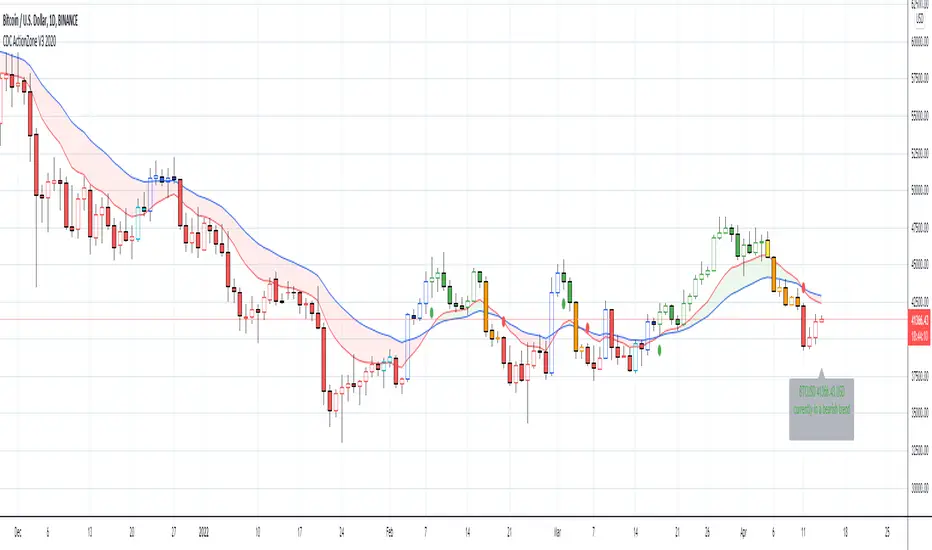
CDC ActionZone V3 2020## CDC ActionZone V3 2020 ##
This is an update to my earlier script, CDC ActionZone V2
The two scripts works slightly differently with V3 reacting slightly faster.
The main update is focused around conforming the standard to Pine Script V4.
## How it works ##
ActionZone is a very simple system, utilizing just two exponential moving
averages. The 'Zones' in which different 'actions' should be taken is
highlighted with different colors on the chart. Calculations for the zones
are based on the relative position of price to the two EMA lines and the
relationship between the two EMAs
CDCActionZone is your barebones basic, tried and true, trend following system
that is very simple to follow and has also proven to be relatively safe.
## How to use ##
The basic method for using ActionZone is to follow the green/red color.
Buy when bar closes in green.
Sell when bar closes in red.
There is a small label to help with reading the buy and sell signal.
Using it this way is safe but slow and is expected to have around 35-40%
accuracy, while yielding around 2-3 profit factors. The system works best
on larger time frames.
The more advanced method uses the zones to switch between different
trading system and biases, or in conjunction with other indicators.
example 1:
Buy when blue and Bullish Divergence between price and RSI is visible,
if not Buy on Green and vise-versa
example 2:
Set up a long-biased grid and trade long only when actionzone is in
green, yellow or orange.
change the bias to short when actionzone turns to te bearish side
(red, blue, aqua)
(Look at colors on a larger time frame)
## Note ##
The price field is set to close by default. change to either HL2 or OHLC4
when using the system in intraday timeframes or on market that does not close
(ie. Cryptocurrencies)
## Note2 ##
The fixed timeframe mode is for looking at the current signal on a larger time frame
ie. When looking at charts on 1h you can turn on fixed time frame on 1D to see the
current 'zone' on the daily chart plotted on to the hourly chart.
This is useful if you wanted to use the system's 'Zones' in conjunction with other
types of signals like Stochastic RSI, for example.
Rate Of Change - Weekly SignalsRate of Change - Weekly Signals
This indicator gives a potential "buy signal" using Rate of Change of SPX and VIX together,
using the following criteria:
SPX Weekly ROC(10) has been BELOW -9 and now rises ABOVE -5
*PLUS*
VIX Weekly ROC(10) has been ABOVE +80 and now falls BELOW +10
The background will turn RED when ROC(SPX) is below -9 and ROC(VIX) is above +80.
The background will turn GREEN when ROC(SPX) is above -5 and ROC(VIX) is below +10.
So the potential "buy signal" is when you start to get GREEN BARS AFTER RED - usually with
some white/empty bars in between...but wait for the green. This indicates that the volatility
has settled down, and the market is starting to turn up.
This indicator gives excellent entry points, but be careful of the occasional false signals.
See Nov. 2001 and Nov. 2008, in both cases the market dropped another 25-30% before the final
bottom was formed. Always have an exit strategy, especially when buying in after a downtrend.
How I use this indicator, pretty much as shown in the preview. Weekly SPX as the main chart with
some medium/long moving averages to identify the trend, VIX added as a "Compare Symbol" in red,
and then the Weekly ROC signals below.
For the ROC graphs, you can show SPX+VIX together, SPX alone, or VIX alone. I prefer to display
them separately because they don't scale well together (VIX crowds out the SPX when it spikes).
Background color is still based on both SPX/VIX together, regardless of which graph is shown.
Note that there is no VIX data available on Trading View prior to 1990, so for those dates the
formula is using only ROC(SPX) and the assigned thresholds (-9 and -5, or whatever you choose).

Simple EMA Trading SignalUse it on:
1. Heiken Ashi, Bitstamp: BTCUSD , M15
2. Heiken Ashi, Bitstamp: BTCUSD, D1
3. USOIL Candlesticks H1
4. EURUSD Daily Candlesticks
5. GBPUSD Daily Candlesticks
6. SPX W1 Candlesticks
7. SPX H1 Heiken Ashi
8. XAUUSD Daily

Experimental Entry Interface (Buy Arrows with TP & SL)This script provides high probability entry points and includes Take Profit and Stop Loss targets.
It attempts to predict when the market conditions are set to move up, and prints long positions.
In addition to Long Entry Arrows, it will print Take Profit / Stop Loss targets.
This indicator is highly adjustable. Hence the name 'Experimental' in the title. Experiment with it to find the results you want.
Designed for use on the 1H timeframe in Forex, but could possibly be useful elsewhere. Do your own testing.
This indicator can repaint. It is best used with alerts set for once per bar close, so that your alerts do not repaint and your trades are solid.
Not ever signal is a winner. Backtest thoroughly. Adjust accordingly.
Arrows
Four sets of colored arrows are included.
💵 💶 Green and Blue Entry Arrows are formed when the market is in an uptrend, and has a momentary pullback.
💴 💷 Yellow and Purple Entry Arrows are formed when the market is just starting to recover from being severely oversold.
Backtest Mode
Turn on Backtest Mode to easily see if an entry ended up as a winner or loser. A Take Profit and Stop Loss line will be drawn to show results.
Take Profit & Stop Loss Targets
You have two options for this.
Price will show you where your TP/SL exits should be placed. These values will show up under the arrow, based on your Risk/Reward ratio.
Pips are much more simple, and will only show you the market entry point and how many pips up/down to place your SL/TP. Warning: This is fixed at a 1:1 RRR .
Risk/Reward Adjustment
Each entry arrow color allows custom risk/reward ratio adjustment.
Dollar Amounts Displayed
Change your account value and leverage to see how much you would have won on each trade.
How to trade with it?
(Forex, 1H) Open the settings, and turn on all the arrow entries. Turn on Backtest mode to see how past trades would have played out. Turn on TakeProfit/StopLoss Targets to see where to set your targets, for each arrow. Set an alert to notify you once per candle close when there is an Entry. Trade happy!
Bill Williams Alligators are also included, if you want. Not necessary though. Some of the calculations depend on them for trend direction analysis.

Relative Volume RVOL AlertsRelative Volume or RVOL is an indicator used to help determine the amount of volume change over a given period of time.
It is often used to help traders determine how in-play a ticker is.
General rule of thumb is the higher the RVOL, the more in play a stock is.
I myself like to use it as a substitute of the volume indicator itself.
Basic Calculation:
Relative Volume = Current Volume / Average Volume
Crossover Signals:
Any time there is a volume spike which causes a crossover of the user set 'Smoothed Moving Average' or 'Threshold' a green/red dot will appear at the top. The color of the dot is dependent on closing of the candle. Therefore it does not necessarily mean price will continue in that direction since volume spikes often happen in peaks or valleys.
Threshold:
The level at which custom alerts and signal can be set. The higher the value, the more volume required to trigger.
Built in Alerts:
You can set custom alerts for the crossovers of the adjustable threshold, or the average RVOL band.

MT4 MACD This is a plain macd similar to the one on the mt4
There are extra colors added for visuals
Primarily requested by user Sonja.
macd // signalline // macdmt4 // mt4macd
Smeared VCIThis indicator can be used to enter the market.
When the signal line crosses upwards the base line, enter short;
when the signal line crosses downwards the base line, enter long;
A filter can be used to enter short when in a downtrend or long in an uptrend.
A fair filter can be the ema(200) line defining an uptrend when price is above it or
a down trend when the price lies below.
Use at your own risk.
Hitting the like button is a free act of gratitude.
Have fun.

RSI/MFI - MTF - Entry signals/Trend colored bars - JD@version=2
This indicator is designed to give early entry signals as well as to follow trend moves, according to different settings.
The indicator shows a histogram of the RSI ro MFI in relation to an ema of the RSI or MFI.
The histogram is then smoothed to give early reversal/entry signals.
The actual RSI/MFI line with oversold/overbought indication can be displayed or omitted, as preferred.
in addition to the RSI/MFI line or as an alternative to it, the background colour can be set to change folowing the RSI/MFI signals.
The timeframe can be chosen. Higher timeframes (eg. 3h) tend to give less false signals.
version 5.
added support for custom Multiple Time Frame selection.
added option for choice of RSI or MFI as base indicator.
added option for price bar coloring according to the indicator. (deselecting "borders" in the "style" tab is recommended)
price bar coloring can be adjusted for different strategies:
1. following the slope of the histogram (for faster entry/exit signals)
2. according to positive or negative histogram (for longer moves)
3. according to pos. or neg. RSI/MFI (for longer term trend holds)
4. uptrend: biased towards faster buy signals and slower sell signals to stay in the uptrend
5. downtrend: biased towards faster sell signals and slower buy signals to stay in the downtrend
A longer timeframe (eg. 3x) is recommended for following trend moves.
try different strategies to see what works better for RSI or MFI.
JD.

TRIX Histogram R1-12 by JustUncleLCreated by request.
Description:
This study is an implementation of the Standard TRIX indicator (a momentum oscillator), shown in coloured histogram format by default, with optional Bar colouring of TRIX zero cross overs. Other options include showing TRIX as a line graph instead of histogram and an optional TRIX signal line with difference histogram (to highlight signal line crosses).
References:
forex-indicators.net
"TRIX MA" by munkeefonix

B3 ECOBlau's Ergodic Candlestick Oscillator = a decent trend finder, however slightly lagged. It can help you to see a reversal entry if you are looking for one. I find the one line ECO hard to use, so I have created this histogram version with a signal line. The colors help to show you whats going on with the ECO and its bias. This indicator shows up in a couple books by people other than Blau, and namely by Krausz. You can also see divergences, for example in pic above the lower or second of the two green humps showing that the general uptrend might be weakened as this run contained less momentum. Tighten up the signal line to see a faster change in its color. These settings are the B3 input settings for default, meaning the ones I use in trading. They are not however the default values you might read about other places.

MACD X SignalsThis is a fundamental signal indicator based on MACD crossovers. It enhances the standard MACD by adding visual labels that classify signals based on their location relative to the Zero Line. This helps identify whether a trend is reversing, continuing, or potentially overextended.
Signal Legend:
B (Reversal): Bullish crossover in the Negative Zone .
B+ (Neutral): Bullish crossover in the Middle Zone .
B- (Trend): Bullish crossover in the Positive Zone
S : MACD crossing down (Bearish signal).

Rahul Prakash's BUY/SELL signal for momentum tradeBuy or Sell signal with just on one confirmation candle.
Show a Buy singal then wait for the confirmation candle, is a strong Buy signal.
Show a Sell singal then wait for the confirmation candle, is a strong Sell signal.
You can use as a free version and earn money. Please are taking lots of price for this type of indicator.

Tomb Reversal Signal Engulfing + RSI Momentum DetectorTomb is a fast and minimalistic reversal-detection indicator built to capture high-probability turning points in the market.
It combines engulfing candlestick patterns, a strong candle body filter, and RSI momentum analysis to generate precise BUY and SELL signals with minimal noise.
🔍 How it Works
The indicator triggers:
✅ BUY Signal
Bullish engulfing pattern appears
Candle body strength > 50% of total range (real momentum)
RSI below 50 (bearish momentum weakening)
Price decreasing over the last 5 bars (down-trend exhaustion)
✅ SELL Signal
Bearish engulfing pattern
Candle body shows strength
RSI above 50 (bullish momentum weakening)
Price increasing over the last 5 bars (up-trend exhaustion)
⚡ Why Tomb Works
Filters out weak signals using candle structure
Detects momentum shifts early
Works on all markets: Crypto, Forex, Indices, Stocks
Ideal for scalping, day trading, or swing trading
🎯 Purpose
To highlight the exact moments where the market shows exhaustion and is ready to reverse—before most traders see it.
📌 Recommended Use
For best performance:
Combine with trend tools such as EMA 200 or market structure
Look for signals at support/resistance or liquidity zones

SCOTTGO Advanced MACD🌟 Custom MACD: Enhanced Visuals & Crossover Signals
This indicator is a highly customized version of the traditional Moving Average Convergence Divergence (MACD) oscillator, designed to provide clear, immediate visual confirmation of signal line crossovers and zero-line crossings.
Core Features:
MACD Crossover Shadow Fill: The area between the MACD line and the Signal line is filled with a customizable shadow. This instantly visualizes whether the MACD is above (bullish crossover) or below (bearish crossover) the Signal line.
Signal Crossover Markers (Arrows & Dots):
Crossover Dot: A small, configurable solid dot is plotted exactly at the point where the MACD and Signal lines intersect, providing pinpoint accuracy for the crossover event.
Crossover Arrows: Customizable up (green) and down (red) arrows are plotted using a small numerical offset from the crossover point, ensuring visibility without cluttering the indicator lines.
Zero-Line Crossing Markers: Distinct, small markers (circles/diamonds) are used to signal when the MACD line crosses the zero line, indicating a shift in momentum relative to the baseline.
Customizable MA Type: The user can select either Exponential Moving Average (EMA) or Simple Moving Average (SMA) for both the MACD oscillator calculation and the signal line calculation.
This indicator is ideal for traders who rely on MACD crossovers and require precise, configurable visual feedback directly on the chart.

Fair Value Gap Signals [Kodexius]Fair Value Gap Signals is an advanced market structure tool that automatically detects and tracks Fair Value Gaps (FVGs), evaluates the quality of each gap, and highlights high value reaction zones with visual metrics and signal markers.
The script is designed for traders who focus on liquidity concepts, order flow and mean reversion. It goes beyond basic FVG plotting by continuously monitoring how price interacts with each gap and by quantifying three key aspects of each zone:
-Entry velocity inside the gap
-Volume absorption during tests
-Structural integrity and depth of penetration
The result is a dynamic, information rich visualization of which gaps are being respected, which are being absorbed, and where potential reversals or continuations are most likely to occur.
All visual elements are configurable, including the maximum number of visible gaps per direction, mitigation method (close or wick) and an ATR based filter to ignore insignificant gaps in low volatility environments.
🔹 Features
🔸 Automated Fair Value Gap Detection
The script detects both bullish and bearish FVGs based on classic three candle logic:
Bullish FVG: current low is strictly above the high from two bars ago
Bearish FVG: current high is strictly below the low from two bars ago
🔸 ATR Based Gap Filter
To avoid clutter and low quality signals, the script can ignore very small gaps using an ATR based filter.
🔸Per Gap State Machine and Lifecycle
Each gap is tracked with an internal status:
Fresh: gap has just formed and has not been tested
Testing: price is currently trading inside the gap
Tested: gap was tested and left, waiting for a potential new test
Rejected: price entered the gap and then rejected away from it
Filled: gap is considered fully mitigated and no longer active
This state machine allows the script to distinguish between simple touches, multiple tests and meaningful reversals, and to trigger different alerts accordingly.
🔸 Visual Ranking of Gaps by Metrics
For each active gap, three additional horizontal rank bars are drawn on top of the gap area:
Rank 1 (Vel): maximum entry velocity inside the gap
Rank 2 (Vol): relative test volume compared to average volume
Rank 3 (Dpt): remaining safety of the gap based on maximum penetration depth
These rank bars extend horizontally from the creation bar, and their length is a visual score between 0 and 1, scaled to the age of the gap. Longer bars represent stronger or more favorable conditions.
🔸Signals and Rejection Markers
When a gap shows signs of rejection (price enters the gap and then closes away from it with sufficient activity), the script can print a signal label at the reaction point. These markers summarize the internal metrics of the gap using a tooltip:
-Velocity percentage
-Volume percentage
-Safety score
-Number of tests
🔸 Flexible Mitigation Logic (Close or Wick)
You can choose how mitigation is defined via the Mitigation Method input:
Close: the gap is considered filled only when the closing price crosses the gap boundary
Wick: a full fill is detected as soon as any wick crosses the gap boundary
🔸 Alert Conditions
-New FVG formed
-Price entering a gap (testing)
-Gap fully filled and invalidated
-Rejection signal generated
🔹Calculations
This section summarizes the main calculations used under the hood. Only the core logic is covered.
1. ATR Filter and Gap Size
The script uses a configurable ATR length to filter out small gaps. First the ATR is computed:
float atrVal = ta.atr(atrLength)
Gap size for both directions is then measured:
float gapSizeBull = low - high
float gapSizeBear = low - high
If useAtrFilter is enabled, gaps smaller than atrVal are ignored. This ties the minimum gap size to the current volatility regime.
2. Fair Value Gap Detection
The basic FVG conditions use a three bar structure:
bool fvgBull = low > high
bool fvgBear = high < low
For bullish gaps the script stores:
-top as low of the current bar
-bottom as high
For bearish gaps:
-top as high of the current bar
-bottom as low
This defines the price range that is considered the imbalance area.
3. Depth and Safety Score
Depth measures how far price has penetrated into the gap since its creation. For each bar, the script computes a currentDepth and updates the maximum depth:
float currentDepth = 0.0
if g.isBullish
if l < g.top
currentDepth := g.top - l
else
if h > g.bottom
currentDepth := h - g.bottom
if currentDepth > g.maxDepth
g.maxDepth := currentDepth
The safety score expresses how much of the gap remains intact:
float depthRatio = g.maxDepth / gapSize
float safetyScore = math.max(0.0, 1.0 - depthRatio)
safetyScore near 1: gap is mostly untouched
safetyScore near 0: gap is mostly or fully filled
4. Velocity Metric
Velocity captures how aggressively price moves inside the gap. It is based on the body to range ratio of each bar that trades within the gap and rewards bars that move in the same direction as the gap:
float barRange = h - l
float bodyRatio = math.abs(close - open) / barRange
float directionBonus = 0.0
if g.isBullish and close > open
directionBonus := 0.2
else if not g.isBullish and close < open
directionBonus := 0.2
float currentVelocity = math.min(bodyRatio + directionBonus, 1.0)
The gap keeps track of the strongest observed value:
if currentVelocity > g.maxVelocity
g.maxVelocity := currentVelocity
This maximum is later used as velScore when building the velocity rank bar.
5. Volume Accumulation and Volume Score
While price is trading inside a gap, the script accumulates the traded volume:
if isInside
g.testVolume += volume
It also keeps track of the number of tests and the volume at the start of the first test:
if g.status == "Fresh"
g.status := "Testing"
g.testCount := 1
g.testStartVolume := volume
An average volume is computed using a 20 period SMA:
float volAvg = ta.sma(volume, 20)
The expected volume is approximated as:
float expectedVol = volAvg * math.max(1, (bar_index - g.index) / 2)
The volume score is then:
float volScore = math.min(g.testVolume / expectedVol, 1.0)
This produces a normalized 0 to 1 metric that shows whether the gap has attracted more or less volume than expected over its lifetime.
6. Rank Bar Scaling
All three scores are projected visually along the time axis as horizontal bars. The script uses the age of the gap in bars as the maximum width:
float maxWidth = math.max(bar_index - g.index, 1)
Then each metric is mapped to a bar length:
int len1 = int(math.max(1, maxWidth * velScore))
g.rankBox1.set_right(g.index + len1)
int len2 = int(math.max(1, maxWidth * volScore))
g.rankBox2.set_right(g.index + len2)
int len3 = int(math.max(1, maxWidth * safetyScore))
g.rankBox3.set_right(g.index + len3)
This creates an intuitive visual representation where stronger metrics produce longer rank bars, making it easy to quickly compare the relative quality of multiple FVGs on the chart.

3 Lines RCI + Psy Signal + RSI Background📌 3 Lines RCI + Psy Signal + RSI Background
This indicator combines three RCI lines, Psychological Line signals, RSI-based background highlights, and ADX strength detection to visualize market momentum, trend strength, and potential reversal zones.
🔍 Main Features
📌 1. Triple RCI (Rank Correlation Index)
Displays Short / Mid / Long RCI
Detects momentum shifts and trend reversals
Highlight zones:
Overbought: +80 ~ +100 (Red Zone)
Oversold: -80 ~ -100 (Green Zone)
📌 2. Psychological Line Signal
Column bars appear only in extreme conditions:
Overbought → Red Bars
Oversold → Green Bars
Helps detect short-term sentiment extremes
📌 3. RSI Background Highlight
Red Background: RSI > Overbought threshold
Green Background: RSI < Oversold threshold
Provides a visual cue of underlying market pressure.
📌 4. ADX Trend Strength
ADX line color shows strength level:
Blue: Weak trend
Yellow: Moderate trend
Red: Strong trend
Useful to identify whether signals occur in a trend or range state.
🎯 Trading Usage Tips
RCI + RSI + Psy confluence can identify strong reversal timing.
Use signals only when ADX is weak or moderate to avoid counter-trading a strong trend.
Combine short/mid RCI crossovers with extreme zones for potential entry timing.
⚙️ Suitable For
Scalping, day trading, swing trading
Stocks, Forex, Crypto, Indices, Commodities

Stochastic + MACD Alignment Signals//@version=5
indicator("Stochastic + MACD Alignment Signals", overlay=true)
// ————— INPUTS —————
stochLength = input.int(14, "Stoch Length")
k = input.int(3, "K Smoothing")
d = input.int(3, "D Smoothing")
macdFast = input.int(12, "MACD Fast Length")
macdSlow = input.int(26, "MACD Slow Length")
macdSignal = input.int(9, "MACD Signal Length")
emaLen = input.int(21, "EMA Filter Length")
// ————— CALCULATIONS —————
// Stochastic
kRaw = ta.stoch(close, high, low, stochLength)
kSmooth = ta.sma(kRaw, k)
dSmooth = ta.sma(kSmooth, d)
// MACD
macd = ta.ema(close, macdFast) - ta.ema(close, macdSlow)
signal = ta.ema(macd, macdSignal)
hist = macd - signal
// EMA Filter
ema = ta.ema(close, emaLen)
// ————— SIGNAL CONDITIONS —————
// BUY CONDITIONS
stochBull = ta.crossover(kSmooth, dSmooth) and kSmooth < 20
macdBull = ta.crossover(macd, signal) or (hist > 0)
emaBull = close > ema
buySignal = stochBull and macdBull and emaBull
// SELL CONDITIONS
stochBear = ta.crossunder(kSmooth, dSmooth) and kSmooth > 80
macdBear = ta.crossunder(macd, signal) or (hist < 0)
emaBear = close < ema
sellSignal = stochBear and macdBear and emaBear
// ————— PLOTTING SIGNALS —————
plotshape(buySignal, title="BUY", style=shape.labelup,
color=color.new(color.green, 0), size=size.large, text="BUY")
plotshape(sellSignal, title="SELL", style=shape.labeldown,
color=color.new(color.red, 0), size=size.large, text="SELL")
// ————— OPTIONAL ALERTS —————
alertcondition(buySignal, title="Buy Signal", message="Stoch + MACD Alignment BUY")
alertcondition(sellSignal, title="Sell Signal", message="Stoch + MACD Alignment SELL")
Setup Keltner Banda 3 e 5 - MMS + RSI + Distância Tabela
📊 Indicator Overview: Keltner Bands + RSI + Distance Table
This custom TradingView indicator combines three powerful tools into a single, visually intuitive setup:
Keltner Channels (Bands 3x and 5x ATR)
Relative Strength Index (RSI)
Dynamic Table Displaying RSI and Price Distance from Moving Average (MMS)
🔧 Components and Functions
1. Keltner Channels (3x and 5x ATR)
Based on a Simple Moving Average (MMS) and Average True Range (ATR).
Two sets of bands are plotted:
3x ATR Bands: Used for moderate volatility signals.
5x ATR Bands: Used for high volatility extremes.
Visual fills between bands help identify overextended price zones.
2. RSI (Relative Strength Index)
Measures momentum and potential reversal zones.
Customizable overbought (default 70) and oversold (default 30) levels.
RSI values are color-coded in the table:
Green for RSI ≤ 30 (oversold)
Blue for 30 < RSI ≤ 70 (neutral)
Red for RSI > 70 (overbought)
3. Distance Table (Price vs. MMS)
Displays the real-time distance between the current price and the MMS:
In points (absolute difference)
In percentage (relative to MMS)
Helps traders assess how far price has deviated from its mean.
📈 How to Use
Trend Reversal Signals
Look for price crossing back inside the 3x or 5x Keltner Bands.
Confirm with RSI:
RSI > 70 + price re-entering from above = potential short
RSI < 30 + price re-entering from below = potential long
Volatility Zones
Price outside the 5x band indicates extreme movement.
Use this to anticipate mean reversion or breakout continuation.
Table Insights
Monitor RSI and price distance in real time.
Use color cues to quickly assess momentum and stretch.
⚙️ Customization
Adjustable parameters for:
MMS period
ATR multipliers
RSI period and thresholds
Table position on chart
Fill colors between bands
This indicator is ideal for traders who want a clean, data-rich visual tool to track volatility, momentum, and price deviation in one place.

Structure Breakout - Buy Sell IndicatorStructure Breakout - Buy Sell Indicator
📈 OVERVIEW:
A minimalist indicator that identifies market structure breakouts using swing point analysis.
Displays clear blue buy arrows and red sell arrows when price breaks key swing levels.
🔧 HOW IT WORKS:
1. Identifies swing highs and lows using configurable lookback period
2. Triggers BUY signal (blue arrow) when price closes above previous swing high
3. Triggers SELL signal (red arrow) when price closes below previous swing low
4. Uses clean visual arrows without cluttering the chart
⚙️ KEY FEATURES:
• Clean, uncluttered visual signals
• Customizable sensitivity period
• Blue arrows for buy signals (below bars)
• Red arrows for sell signals (above bars)
• No lagging repainting
• Works on all timeframes
🎯 TRADING APPLICATIONS:
• Swing trading entries
• Breakout confirmation
• Trend continuation signals
• Support/resistance breaks
⚡ SETTINGS:
• Structure Detection Period (default: 20) - Adjust sensitivity of swing detection
⚠️ RISK DISCLAIMER:
This is an educational tool. Always use proper risk management.
Past performance does not guarantee future results.
