Harmony in Havoc - The Entropy of VoVix Harmony in Havoc – The Entropy of VoVix
There are moments in the market when chaos and order are not opposites, but partners in a dance.
Harmony in Havoc is not just an indicator—it’s a window into that dance.
Most tools try to tame the market by smoothing it, boxing it in, or chasing after what’s already happened. This script does the opposite: it listens for the music beneath the noise, the rare moments when volatility and unpredictability align, and the market’s next movement is about to begin.
What is Harmony in Havoc?
VoVix Spike:
The pulse of volatility-of-volatility. Not just how much the market is moving, but how violently its own heartbeat is changing.
Entropy:
A real-time measure of surprise. When entropy is high, the market is not just moving—it’s breaking its own patterns, rewriting its own rules.
Progression Bar & Status:
The yellow bar is your visual gauge of tension. As it fills, the market is winding up.
Wait: The world is calm.
Get ready!: The storm is building.
Take Action!!: The probability of a regime eruption is at its peak.
Yellow Background:
When the background glows, the market is at its most unstable—this is not a buy or sell signal, but a quant alert.
How does it work?
Every tick, Harmony in Havoc measures the distance between the market’s current volatility and its own unpredictability. When the VoVix spike approaches or exceeds the entropy threshold, the system knows:
“This is the moment when the improbable becomes possible.”
Why is this different?
It doesn’t tell you what to do.
It doesn’t chase price.
It doesn’t care about trends, bands, or the past.
Instead, it gives you a quantitative sense of anticipation—a way to see when the market is most likely to break from its own history, and when the edge is at its sharpest.
How to use it:
Watch for the yellow background and “Take Action!!” status.
Use it as a regime filter, a volatility dashboard, or a warning system for your own strategies.
Tune the inputs for your asset and timeframe—make it your own.
Inputs—explained for you:
VoVix Fast/Slow ATR & Stdev:
Control how sensitive the system is to volatility shocks. Lower = more signals, higher = only the rarest events.
Entropy Window & Bins:
Control how “surprised” the entropy engine is by current volatility. Shorter window = more responsive, more bins = finer detail.
Show/Hide Controls:
Toggle the VoVix spike, entropy line, and their glows to customize your visual experience.
Bottom line:
This is not a buy or sell script.
This is a quant regime detector for those who want to feel the market’s tension—to sense when harmony and havoc are about to collide.
Disclaimer:
Trading is risky. This script is for research and informational purposes only, not financial advice. Backtest, paper trade, and know your risk before going live. Past performance is not a guarantee of future results.
*I've only tested this on 1 and 5 min frames.
Use with discipline. Trade your edge.
— Dskyz, for DAFE Trading Systems
3 days ago
Release Notes
* Now mobile friendly. I've added a toggle to switch the dashboard on/off, and added a mobile information line that shows the same information on the dashboard. This is to allow the script to stay visually in balance and this also has a toggle.
* Background color added that coresponds with Buy or Sell areas.
標準偏差

Kernel Regression Bands SuiteMulti-Kernel Regression Bands
A versatile indicator that applies kernel regression smoothing to price data, then dynamically calculates upper and lower bands using a wide variety of deviation methods. This tool is designed to help traders identify trend direction, volatility, and potential reversal zones with customizable visual styles.
Key Features
Multiple Kernel Types: Choose from 17+ kernel regression styles (Gaussian, Laplace, Epanechnikov, etc.) for smoothing.
Flexible Band Calculation: Select from 12+ deviation types including Standard Deviation, Mean/Median Absolute Deviation, Exponential, True Range, Hull, Parabolic SAR, Quantile, and more.
Adaptive Bands: Bands are calculated around the kernel regression line, with a user-defined multiplier.
Signal Logic: Trend state is determined by crossovers/crossunders of price and bands, coloring the regression line and band fills accordingly.
Custom Color Modes: Six unique color palettes for visual clarity and personal preference.
Highly Customizable Inputs: Adjust kernel type, lookback, deviation method, band source, and more.
How to Use
Trend Identification: The regression line changes color based on the detected trend (up/down)
Volatility Zones: Bands expand/contract with volatility, helping spot breakouts or mean-reversion opportunities.
Visual Styling: Use color modes to match your chart theme or highlight specific market states.
Credits:
Kernel regression logic adapted from:
ChartPrime | Multi-Kernel-Regression-ChartPrime (Link in the script)
Disclaimer
This script is for educational and informational purposes only. Not financial advice. Use at your own risk.

Percentage SDThis TradingView indicator, called "Percentage SD," measures how much the price of an asset is fluctuating (its volatility) and shows this as a percentage.
You can choose which price to track (like the closing price) and the period over which to measure this volatility.
The indicator then draws a yellow line in a separate panel below your main chart. When this line is higher, it means the price is more volatile relative to its current level. A lower line suggests less volatility. This can help you see when price movements are becoming more or less active.

Price Lag Factor (PLF)📊 Price Lag Factor (PLF) for Crypto Traders: A Comprehensive Breakdown
The Price Lag Factor (PLF) is a momentum indicator designed to identify overextended price movements and gauge market momentum. It is particularly optimized for the crypto market, which is known for its high volatility and rapid trend shifts.
🔎 What is the Price Lag Factor (PLF)?
The PLF measures the difference between long-term and short-term price momentum and scales it dynamically based on recent volatility. This helps traders identify when the market might be overbought or oversold while filtering out noise.
The formula used in the PLF calculation is:
PLF = (Z-Long - Z-Short) / Stdev(PLF)
Where:
Z-long: Z-score of the long-term moving average (50-period by default).
Z-short: Z-score of the short-term moving average (14-period by default).
Stdev(PLF): Standard deviation of the PLF over a longer period (50-period by default).
🧠 How to Interpret the PLF:
1. Trend Direction:
Positive PLF (Green Bars): Indicates bullish momentum. The long-term trend is up, and short-term movements are confirming it.
Negative PLF (Red Bars): Indicates bearish momentum. The long-term trend is down, and short-term movements are consistent with it.
2. Momentum Strength:
PLF near Zero (±0.5): Low momentum; trend direction is not strong.
PLF between ±1 and ±2: Moderate momentum, indicating that the market is moving with strength but not in an overextended state.
PLF beyond ±2: High momentum (overbought/oversold), indicating potential trend exhaustion and a possible reversal.
📈 Trading Strategies:
1. Trend Following:
Bullish Signal:
Enter long when PLF crosses above 0 and remains green.
Confirm with other indicators like RSI or MACD to reduce false signals.
Bearish Signal:
Enter short when PLF crosses below 0 and remains red.
Use trend confirmation (e.g., moving average crossover) for better accuracy.
2. Reversal Trading:
Overbought Signal:
If PLF rises above +2, look for signs of bearish divergence or a reversal pattern to consider a short entry.
Oversold Signal:
If PLF falls below -2, watch for bullish divergence or a support bounce to consider a long entry.
3. Momentum Divergence:
Bullish Divergence:
Price makes a lower low while PLF makes a higher low.
Indicates weakening bearish momentum and a potential bullish reversal.
Bearish Divergence:
Price makes a higher high while PLF makes a lower high.
Signals weakening bullish momentum and a potential bearish reversal.
💡 Best Practices:
Combine with Volume:
Volume spikes during high PLF readings can confirm trend continuation.
Low volume during PLF extremes may hint at false breakouts.
Watch for Extreme Levels:
PLF beyond ±2 suggests overextended price action. Use caution when entering new positions.
Confirm with Other Indicators:
Use with Relative Strength Index (RSI) or Bollinger Bands to get a better sense of overbought/oversold conditions.
Overlay with a moving average to gauge trend consistency.
🚀 Why the PLF Works for Crypto:
Crypto markets are highly volatile and prone to rapid trend changes. The PLF's adaptive scaling ensures it remains relevant regardless of market conditions.
It highlights momentum shifts more accurately than static indicators because it accounts for changing volatility in its calculation.
🚨 Disclaimer for Traders Using the Price Lag Factor (PLF) Indicator:
The Price Lag Factor (PLF) indicator is designed as a technical analysis tool to gauge momentum and identify potential overbought or oversold conditions. However, it should not be relied upon as a sole decision-making factor for trading or investing.
Important Points to Consider:
Market Risk: Trading cryptocurrencies and other financial assets involves significant risk. The PLF may not accurately predict future price movements, especially during unexpected market events.
Indicator Limitations: No technical indicator, including the PLF, is infallible. False signals can occur, particularly in low-volume or highly volatile conditions.
Supplementary Analysis: Always combine PLF insights with other technical indicators, fundamental analysis, and risk management strategies to make informed decisions.
Personal Judgment: Traders should use their own discretion when interpreting PLF signals and never trade based solely on this indicator.
No Guarantees: The PLF is designed for educational and informational purposes only. Past performance is not indicative of future results.
Always perform thorough research and consider consulting with a professional financial advisor before making any trading decisions.

VolVolVolVol: Volatility & Volume
The indicator consists of 3 oscillating components that are all represented on a positive/negative percentage scale.
Direction : Green/Red shaded area
Smoothened distance between Close and EMA of Close relative to StDev of Close
Intensity : Turquoise line
If direction = bullish: Smoothened distance between Low and EMA of Low relative to StDev of Low
If direction = bearish: Smoothened distance between High and EMA of High relative to StDev of High
Momentum : Fuchsia line
Double exponential average of bullish closing volume - bearish closing volume
The indicator provides the following signals on the candlestick charts based on the above components' movements.
Bullish position signals: Below candles
Bearish position signals: Above candles
Entry signal : Increase in all 3 factors or sharp increase in Intensity + Momentum
Add signal : Trend slowdown because of volume drop or retracement following a temporary consolidation
Exit signal : Increase in Intensity and Momentum against the prevailing trend direction
There may be simultaneous Bullish and Bearish signals. These should be treated as hedges for existing positions.

Day’s Open ForecastOverview
This Pine Script indicator combines two primary components:
1. Day’s Open Forecast:
o Tracks historical daily moves (up and down) from the day’s open.
o Calculates average up and down moves over a user-defined lookback period.
o Optionally includes standard deviation adjustments to forecast potential intraday levels.
o Plots lines on the chart for the forecasted up and down moves from the current day's open.
2. Session VWAP:
o Allows you to specify a custom trading session (by time range and UTC offset).
o Calculates and plots a Volume-Weighted Average Price (VWAP) during that session.
By combining these two features, you can gauge potential intraday moves relative to historical behavior from the open, while also tracking a session-specific VWAP that can act as a dynamic support/resistance reference.
How the Code Works
1. Collect Daily Moves
o The script detects when a new day starts using time("D").
o Once a new day is detected, it stores the previous day’s up-move (dayHigh - dayOpen) and down-move (dayOpen - dayLow) into arrays.
o These arrays keep track of the last N days (default: 126) of up/down move data.
2. Compute Statistics
o The script computes the average (f_average()) of up-moves and down-moves over the stored period.
o It also computes the standard deviation (f_stddev()) of up/down moves for optional “forecast bands.”
3. Forecast Lines
o Plots the current day’s open.
o Plots the average forecast lines above and below the open (Avg Up Move Level and Avg Down Move Level).
o If standard deviation is enabled, plots additional lines (Avg+StdDev Up and Avg+StdDev Down).
4. Session VWAP
o The script detects the start of a user-defined session (via input.session) and resets accumulation of volume and the numerator for VWAP.
o As each bar in the session updates, it accumulates volume (vwapCumulativeVolume) and a price-volume product (vwapCumulativeNumerator).
o The session VWAP is then calculated as (vwapCumulativeNumerator / vwapCumulativeVolume) and plotted.
5. Visualization Options
o Users can toggle standard deviation usage, historical up/down moves plotting, and whether to show the forecast “bands.”
o The vwapSession and vwapUtc inputs let you adjust which session (and time zone offset) the VWAP is calculated for.
________________________________________
How to Use This Indicator on TradingView
1. Create a New Script
o Open TradingView, then navigate to Pine Editor (usually found at the bottom of the chart).
o Copy and paste the entire code into the editor.
2. Save and Add to Chart
o Click Save (give it a relevant title if you wish), then click Add to chart.
o The indicator will appear on your chart with the forecast lines and VWAP.
o By default, it is overlayed on the price chart (because of overlay=true).
3. Customize Inputs
o In the indicator’s settings, you can:
Change lookback days (default: 126).
Enable or disable standard deviation (Include Standard Deviation in Forecast?).
Adjust the standard deviation multiplier.
Choose whether to plot bands (Plot Bands with Averages/StdDev?).
Plot historical moves if desired (Plot Historical Up/Down Moves for Reference?).
Set your custom session and UTC offset for the VWAP calculation.
4. Interpretation
o “Current Day Open” is simply today’s open price on your chart.
o Up/Down Move Lines: Indicate a potential forecast based on historical averages.
If standard deviation is enabled, the second set of lines acts as an extended range.
o VWAP: Helpful for determining intraday price equilibrium over the specified session.
Important Notes / Best Practices
• The script only updates the historical up/down move data once per day (when a new day starts).
• The VWAP portion resets at the start of the specified session each day.
• Standard deviation multiplies the average up/down range, giving you a sense of “volatility range” around the day’s open.
• Adjust the lookback length (dayCount) to balance how many days of data you want to average. More days = smoother but possibly slower to adapt; fewer days = more reactive but potentially less reliable historically.
Educational & Liability Disclaimers
1. Educational Disclaimer
o The information provided by this indicator is for educational and informational purposes only. It is a technical analysis tool intended to demonstrate how to use historical data and basic statistics in Pine Script.
2. No Financial Advice
o This script does not constitute financial or investment advice. All examples and explanations are solely illustrative. You should always do your own analysis before making any investment decisions.
3. No Liability
o The author of this script is not liable for any losses or damages—monetary or otherwise—that may occur from the application of this script.
o Past performance does not guarantee future results, and you should never invest money you cannot afford to lose.
By adding this indicator to your TradingView chart, you acknowledge and accept that you alone are responsible for your own trading decisions.
Enjoy using the “Day’s Open Forecast” and Session VWAP for better market insights!

Spent Output Profit Ratio (SOPR) Z-Score | [DeV]SOPR Z-Score
The Spent Output Profit Ratio (SOPR) is an advanced on-chain metric designed to provide deep insights into Bitcoin market dynamics by measuring the ratio between the combined USD value of all Bitcoin outputs spent on a given day and their combined USD value at the time of creation (typically, their purchase price). As a member of the Realized Profit/Loss family of metrics, SOPR offers a window into aggregate seller behavior, effectively representing the USD amount received by sellers divided by the USD amount they originally paid. This indicator enhances this metric by normalizing it into a Z-Score, enabling a statistically robust analysis of market sentiment relative to historical trends, augmented by a suite of customizable features for precision and visualization.
SOPR Settings -
Lookback Length (Default: 150 days): Determines the historical window for calculating the Z-Score’s mean and standard deviation. A longer lookback captures broader market cycles, providing a stable baseline for identifying extreme deviations, which is particularly valuable for long-term strategic analysis.
Smoothing Period (Default: 100 days): Applies an EMA to the raw SOPR, balancing responsiveness to recent changes with noise reduction. This extended smoothing period ensures the indicator focuses on sustained shifts in seller behavior, ideal for institutional-grade trend analysis.
Moving Average Settings -
MA Lookback Length (Default: 90 days): Sets the period for the Z-Score’s moving average, offering a shorter-term trend signal relative to the 150-day Z-Score lookback. This contrast enhances the ability to detect momentum shifts within the broader context.
MA Type (Default: EMA): Provides six moving average types, from the simple SMA to the volume-weighted VWMA. The default EMA strikes an optimal balance between smoothness and responsiveness, while alternatives like HMA (Hull) or VWMA (volume-weighted) allow for specialized applications, such as emphasizing recent price action or incorporating volume dynamics.
Display Settings -
Show Moving Average (Default: True): Toggles the visibility of the Z-Score MA plot, enabling users to focus solely on the raw Z-Score when preferred.
Show Background Colors (Default: True): Activates dynamic background shading, enhancing visual interpretation of market regimes.
Background Color Source (Default: SOPR): Allows users to tie the background color to either the SOPR Z-Score’s midline (reflecting adjustedZScore > 0) or the MA’s trend direction (zScoreMA > zScoreMA ). This dual-source option provides flexibility to align the visual context with the primary analytical focus.
Analytical Applications -
Bear Market Resistance: When the Z-Score approaches or exceeds zero (raw SOPR near 1), it often signals resistance as sellers rush to exit at break-even, a pattern historically observed during downtrends. A rising Z-Score MA crossing zero can confirm this pressure.
Bull Market Support: Conversely, a Z-Score dropping below zero in uptrends indicates reluctance to sell at a loss, forming support as sell pressure diminishes. The MA’s bullish coloring reinforces confirmation of renewed buying interest.
Extreme Deviations: Values significantly above or below zero highlight overbought or oversold conditions, respectively, offering opportunities for contrarian positioning when paired with other on-chain or price-based metrics.

Advanced Standard Deviation EMAs📊 Advanced Standard Deviation EMAs Indicator
This indicator plots up to 7 customizable EMAs with standard deviation channels which helps traders see the potential levels surrounding the EMAs that accounts for recent volatility.
📈 What is Standard Deviation?
Standard deviation is a statistical measure that quantifies the amount of variation or dispersion in a set of values. In trading, it measures how much price movement deviates from the average (mean) price over a specific period. Higher standard deviation indicates higher volatility, while lower values suggest more consistent price action. When applied to EMAs, standard deviation channels help traders identify when price is behaving normally versus when it's making extraordinary moves, potentially signaling trading opportunities or increased risk.
- - - - - - -
✨ Key Features
- Highly Customizable: Each EMA can be independently configured for maximum flexibility
- Multi-Timeframe Analysis: Each EMA can calculate on its own timeframe while displayed on the same chart
- Adaptive Labels: Smart labels show period, timeframe, and trend direction
- Visual Clarity: Fully customizable colors, transparency, and visual elements
🛠️ Per-EMA Customization
Each of the 7 EMAs offers individual control over:
- 📏 Period Length: Set your preferred EMA calculation period
- ⏱️ Timeframe: Calculate each EMA on its own timeframe (defaults to chart timeframe)
- 📏 Standard Deviation Multiplier: Fine-tune channel width with individual multipliers
- 🎨 Colors: Custom colors for lines, fills, and labels
- 🔍 Visibility: Toggle line, fill, and label visibility independently
- 🌫️ Transparency: Adjust fill transparency for each Standard Deviation Channel
🏷️ Smart Labels
Labels automatically display:
1. EMA length (e.g., "- 200")
2. Calculation timeframe when custom (e.g., "- 200 (240)")
3. Trend direction through color
Label colors indicate trend direction:
- 🟢 Green: EMA is trending upward (customizable)
- 🔴 Red: EMA is trending downward (customizable)
⚙️ Global Settings
- Label Offset: Position labels away from price action (default: 20 bars)
- Label Size: Choose from multiple text sizes
- Quick Toggle: Disable all EMA lines and fills with one click while keeping labels
💡 Use Cases
- Multi-timeframe trend analysis
- Dynamic support/resistance identification
- Price volatility assessment
- Trend strength confirmation
- - - - - -
Comment down below if you have any cool feature ideas or want to show your support and give this indicator a like if you're enjoying it :)
Enjoy!
SS
Standard Deviation Lines v1.0Overview
The Standard Deviation Lines v1.0 indicator is designed to provide a statistical approach to market volatility by plotting multiple standard deviation levels based on price action. This tool helps traders identify key price levels where the market may experience significant reactions, making it useful for trend analysis, support/resistance identification, and volatility-based trading strategies.
Key Features
✅ Dynamic Standard Deviation Levels: Calculates and plots up to ±3 standard deviation levels, giving traders a clear view of price dispersion and potential overbought/oversold areas.
✅ Quadrant-Based Deviation Zones: Divides standard deviation ranges into smaller, meaningful levels (e.g., 0.214, 0.382, 0.50, 0.618, 0.786) for a granular analysis of price movements.
✅ VIX Integration for Volatility Adjustment: Incorporates CBOE:VIX to dynamically adjust standard deviation levels based on market volatility.
✅ Weekly vs. Daily Mode: Users can toggle between weekly and daily standard deviation calculations to adapt to different trading strategies.
✅ Auto-Updating Levels: The indicator refreshes at market close (17:00), ensuring traders work with the latest price data.
✅ Customizable Display: Uses color-coded lines to differentiate between positive and negative deviations, with dashed lines for mid-levels and key support/resistance areas.
How to Use
📌 Trend & Volatility Analysis – Higher standard deviation levels indicate strong price movements, helping traders assess trend strength and market volatility.
📌 Reversal & Continuation Signals – Prices reaching extreme standard deviation levels (±2 or ±3) may suggest potential reversals or breakouts.
📌 Support & Resistance Zones – The quadrant-based deviation zones help identify hidden support/resistance areas where price may react.
📌 Risk Management – Traders can use standard deviation bands to set stop-loss and take-profit levels based on statistical price dispersion.
Best For
🔹 Day traders & swing traders looking to incorporate volatility-based strategies.
🔹 Mean reversion traders who capitalize on price returning to statistical averages.
🔹 Momentum traders who want to confirm trend strength and continuation.
Try the Standard Deviation Lines v1.0 now and enhance your market analysis with a statistical edge!
RVI SD Band Oscillator | BinMastaThe RVI SD Band Oscillator is a momentum-based indicator that enhances trend analysis using the Relative Vigor Index (RVI) with Standard Deviation (SD) Bands. It refines signals by incorporating a signal line and dynamically adjusting bands based on market volatility.
Core Components:
RVI Calculation: Measures price momentum relative to past movements.
Signal Line: A smoothed version of RVI to identify crossovers.
SD Bands: Standard deviation-based boundaries to gauge overbought/oversold conditions.
Trading Logic:
Trend Direction: Determined by RVI crossover with the signal line.
Momentum Confirmation: Identifies shifts in buying and selling strength.
Trade Signals:
Bullish when the trend is up & the signal is near the lower band.
Bearish when the trend is down & the signal is near the upper band.
Visual Features:
Colored candles highlight potential trend shifts.
Signal line plot provides additional confirmation.
Disclaimer:
This indicator is for educational purposes only and should not be considered financial advice. Past performance is not indicative of future results. Always conduct your own analysis and risk management before making trading decisions. 🚀
Sharpe Ratio ScreenerThe original code was created by tim_amblard , and the modifications were made by Mr_Rakun for the purpose of adapting the script into a screener format.
The Sharpe ratio is a popular metric used to measure the risk-adjusted return of an asset or portfolio, which allows traders and investors to assess whether the returns they are receiving are worth the risk they are taking. In this script, the Sharpe ratio is calculated over a 180-day period (approximately 6 months), and several valuation zones are defined based on the ratio to help assess whether an asset is overvalued, undervalued, or critically undervalued.
Key Features:
1. Risk-Free Rate Input: The user can define the risk-free rate (usually the return of government bonds or a similar safe asset) for Sharpe ratio calculation.
2. Lookback Period (180 Days): The default lookback period is set to 180 days (approximately 6 months) to calculate the mean and standard deviation of the asset’s daily returns.
3. Valuation Zones:
• Overvalued Zone: If the Sharpe ratio is greater than 5.
• Undervalued Zone: If the Sharpe ratio is between -1 and 5.
• Critically Undervalued Zone: If the Sharpe ratio is below -3.
• Neutral Zone: If the Sharpe ratio does not meet any of the above conditions.
4. Table View: The script pulls a list of symbols from the user (e.g., cryptocurrency or stock tickers) and displays their latest price, Sharpe ratio, and whether they are in an overvalued, undervalued, or neutral zone in a table format.
5. Custom Symbol Input: The user can input a list of symbols (separated by commas) to track.
6. Daily Timeframe Check: The script warns the user to ensure they are using a daily timeframe, as this indicator is designed specifically for it.
How It Works:
• The script calculates the daily returns for each symbol over the specified lookback period.
• It then calculates the mean and standard deviation of the returns to derive the Sharpe ratio.
• The Sharpe ratio is annualized, and it’s compared to the defined thresholds to categorize the symbol into different valuation zones.
• A table is generated on the chart to show the symbols, their current prices, and their Sharpe ratios, with color-coded background to easily identify whether they are overvalued (red), undervalued (green), or critically undervalued (blue).
This tool is useful for screening multiple assets for their Sharpe ratio to find investment opportunities with optimal risk-adjusted returns.
Original code credit: This code was originally written by tim_amblard and modified by Mr_Rakun for use as a screener.
Türkçe Açıklama:
Orijinal kod tim_amblard tarafından yazılmıştır ve Mr_Rakun tarafından, bu script’in tarayıcı formatına dönüştürülmesi amacıyla değiştirilmiştir.
Sharpe oranı, bir varlığın veya portföyün risk düzeltilmiş getirisini ölçmek için yaygın olarak kullanılan bir metriktir. Bu metrik, yatırımcıların aldıkları risk karşılığında aldıkları getirinin ne kadar verimli olduğunu değerlendirmelerine olanak tanır. Bu script’te, Sharpe oranı 180 günlük bir periyot (yaklaşık 6 ay) boyunca hesaplanır ve oranı baz alarak varlıkların değerleme bölgeleri tanımlanır: aşırı değerli, değerli ve kritik şekilde değersiz.
Ana Özellikler:
1. Risk-Free Rate (Risk-Free Oranı) Girişi: Kullanıcı, Sharpe oranı hesaplaması için risk-free (risksiz) oranı (genellikle devlet tahvilleri veya benzeri güvenli bir varlık getirisi) tanımlayabilir.
2. Lookback (Geribildirim) Periyodu (180 Gün): Varsayılan geribildirim periyodu, varlığın günlük getirilerinin ortalama ve standart sapmalarını hesaplamak için 180 gün (yaklaşık 6 ay) olarak ayarlanmıştır.
3. Değerleme Bölgeleri:
• Aşırı Değerli Bölge: Sharpe oranı 5’ten büyükse.
• Değerli Bölge: Sharpe oranı -1 ile 5 arasında ise.
• Kritik Derecede Değersiz Bölge: Sharpe oranı -3’ten küçükse.
• Nötr Bölge: Sharpe oranı yukarıdaki hiçbir koşulu karşılamıyorsa.
4. Tablo Görünümü: Script, kullanıcıdan alınan semboller listesine göre (örneğin, kripto para veya hisse senedi sembolleri) her bir sembolün son fiyatını, Sharpe oranını ve değerleme bölgesini tablo şeklinde gösterir.
5. Özel Sembol Girişi: Kullanıcı, izlemek istediği semboller listesini (virgülle ayrılmış) girebilir.
6. Günlük Zaman Çerçevesi Kontrolü: Script, kullanıcının doğru sonuçlar almak için günlük zaman çerçevesinde işlem yapması gerektiğini hatırlatır.
Nasıl Çalışır:
• Script, her sembol için belirtilen geribildirim periyodu boyunca günlük getirileri hesaplar.
• Ardından, getirilerin ortalama ve standart sapmasını hesaplayarak Sharpe oranını çıkarır.
• Sharpe oranı yıllıklaştırılır ve tanımlanan eşiklerle karşılaştırılarak sembol, farklı değerleme bölgelerine kategorize edilir.
• Grafik üzerinde, semboller, mevcut fiyatları ve Sharpe oranları gösteren bir tablo oluşturulur. Bu tablo, hangi sembollerin aşırı değerli (kırmızı), değerli (yeşil) veya kritik derecede değersiz (mavi) olduğunu kolayca görmek için renk kodlu arka planlar kullanır.
Bu araç, yatırım fırsatlarını daha verimli bir şekilde değerlendirebilmek için risk düzeltilmiş getiri açısından optimal fırsatları bulmak için birden fazla varlığın Sharpe oranlarını taramak için kullanışlıdır.

Volatility BandsThe Volatility Bands script is a custom indicator designed to help traders visualize volatility levels in the market. It calculates dynamic bands around a central moving average, providing insights into potential support and resistance levels based on recent price action.
The script calculates multiple volatility bands (u0, u1, u2, d0, d1, d2) that adjust based on recent price movements. The outer bands (u2 and d2) represent extreme volatility levels, while the inner bands (u0, u1, d0, d1) indicate more immediate support and resistance.
Look for price reactions at the band levels. A touch of the upper bands may indicate overbought conditions, while a touch of the lower bands may indicate oversold conditions.
Central Moving Average: A smoothed moving average that adapts to price changes, providing a clear trend direction.
The script has no input parameters.
Script Functions:
erf(x): Calculates the error function for a given input x. Used in the calculation of the smoothing factor for the UMA.
uma(input): Provides a smoothed average that adapts to recent price changes, reducing lag compared to traditional moving averages.
dev(input, mu): Used to calculate the volatility bands around the central moving average.

Median Volume Weighted DeviationMVWD (Median Volume Weighted Deviation)
The Median Volume-Weighted Deviation is a technical trend following indicator that overlays dynamic bands on the price chart, centered around a Volume Weighted Average Price (VWAP). By incorporating volume-weighted standard deviation and its median, it identifies potential overbought and oversold conditions, generating buy and sell signals based on price interactions with the bands. The fill color between the bands visually reflects the current signal, enhancing market sentiment analysis.
How it Works
VWAP Calculation: Computes the Volume-Weighted Average Price over a specific lookback period (n), emphasizing price levels with higher volume.
Volume Weighted Standard Deviation: Measures price dispersion around the VWAP, weighted by volume, over the same period.
Median Standard Deviation: Applies a median filter over (m) periods to smooth the stand deviation, reducing noise in volatility estimates.
Bands: Constructs upper and lower bands by adding and subtracting a multiplier (k) times the median standard deviation from the VWAP
Signals:
Buy Signal: Triggers when the closing price crosses above the upper band.
Sell Signal: Triggers when the closing price crosses below the lower band.
Inputs
Lookback (n): Number of periods for the VWAP and standard deviation calculations. Default is set to 14.
Median Standard Deviation (m): Periods for the median standard deviation. Default is set to 2.
Standard Deviation Multiplier (k): Multiplier to adjust band width. Default is set to 1.7 with a step of 0.1.
Customization
Increase the Lookback (n) for a smoother VWAP and broader perspective, or decrease the value for higher sensitivity.
Adjust Median Standard Deviation (m) to control the smoothness of the standard deviation filter.
Modify the multiplier (k) to widen or narrow the bands based on the market volatility preferences.
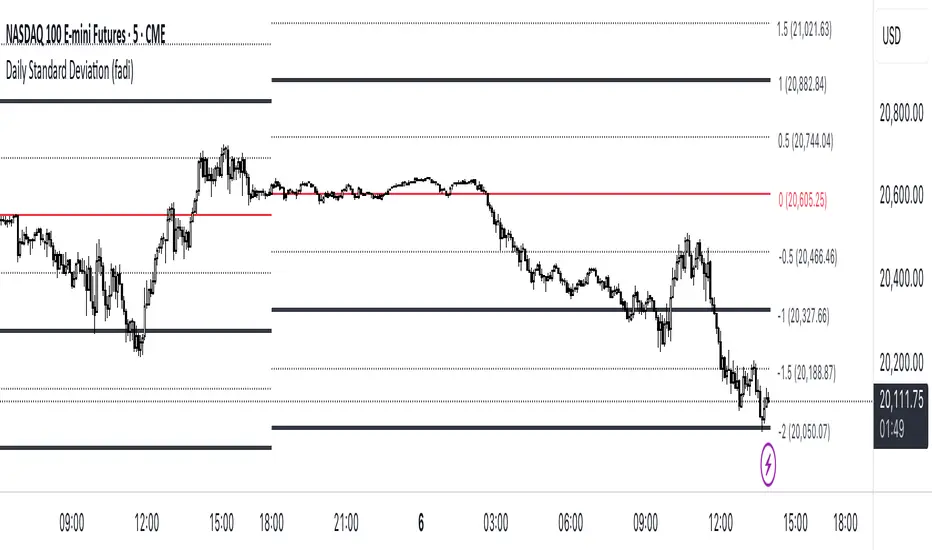
Daily Standard Deviation (fadi)The Daily Standard Deviation indicator uses standard deviation to map out daily price movements. Standard deviation measures how much prices stray from their average—small values mean steady trends, large ones mean wild swings. Drawing from up to 20 years of data, it plots key levels using customizable Fibonacci lines tied to that standard deviation, giving traders a snapshot of typical price behavior.
These levels align with a bell curve: about 68% of price moves stay within 1 standard deviation, 95% within roughly 2, and 99.7% within roughly 3. When prices break past the 1 StDev line, they’re outliers—only 32% of moves go that far. Prices often snap back to these lines or the average, though the reversal might not happen the same day.
How Traders Use It
If prices surge past the 1 StDev line, traders might wait for momentum to fade, then trade the pullback to that line or the average, setting a target and stop.
If prices dip below, they might buy, anticipating a bounce—sometimes a day or two later. It’s a tool to spot overstretched prices likely to revert and/or measure the odds of continuation.
Settings
Open Hour: Sets the trading day’s start (default: 18:00 EST).
Show Levels for the Last X Days: Displays levels for the specified number of days.
Based on X Period: Number of days to calculate standard deviation (e.g., 20 years ≈ 5,040 days). Larger periods smooth out daily level changes.
Mirror Levels on the Other Side: Plots symmetric positive and negative levels around the average.
Fibonacci Levels Settings: Defines which levels and line styles to show. With mirroring, negative values aren’t needed.
Overrides: Lets advanced users input custom standard deviations for specific tickers (e.g., NQ1! at 0.01296).
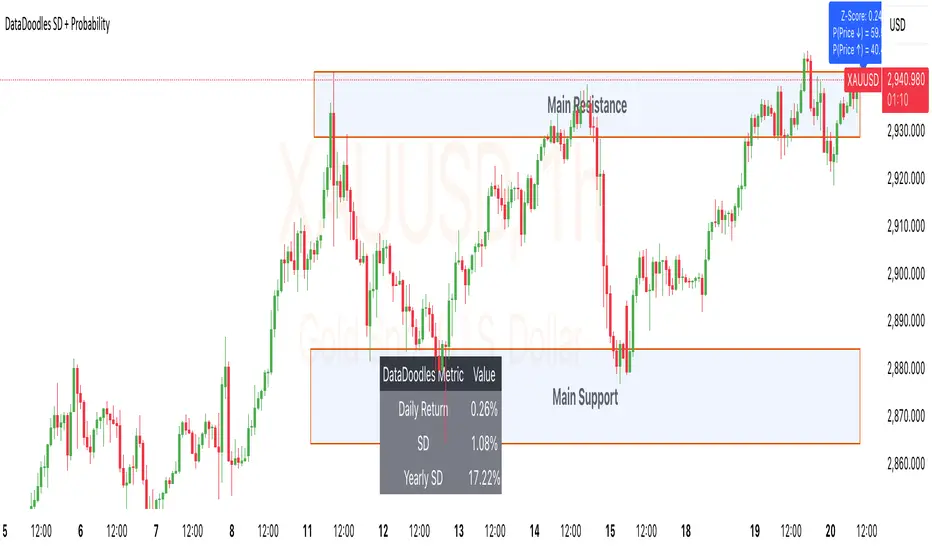
DataDoodles SD + ProbabilityDataDoodles SD + Probability
Overview:
The “DataDoodles SD + Probability” indicator is designed to provide traders with a statistical edge by leveraging standard deviation and probability metrics. This advanced tool calculates the annualized standard deviation, Z-score, and probability of price movements, offering insights into potential market direction with customizable alert thresholds.
Key Features:
1. Annualized Standard Deviation (Volatility) Calculation:
• Uses a user-defined period to compute the rolling standard deviation of daily returns.
• Annualizes the volatility, giving a clear picture of expected price fluctuations.
2. Probability of Price Movement:
• Calculates the probability of price moving up or down using a corrected Z-Score.
• Displays the probability percentage for both upward and downward movements.
3. Dynamic Alerts:
• Configurable alerts for upward and downward price movement probabilities.
• Receive alerts when the probability exceeds user-defined thresholds.
4. Projections and Visuals:
• Plots projected high and low price levels based on annualized volatility.
• Displays Z-Score and probability metrics on the chart for quick reference.
5. Comprehensive Data Table:
• Bottom-center table displays key metrics:
• Daily Return
• Standard Deviation (SD)
• Annualized Standard Deviation (Yearly SD)
User Inputs:
• Annualization Period: Set the time frame for volatility annualization (Default: 252 days).
• SD Period: Define the rolling window for calculating standard deviation (Default: 252 days).
• Alert Probability Up/Down: Customize the probability thresholds for alerts (Default: 90%).
How It Works:
• Data Request and Calculation:
• Uses daily close prices to ensure consistent timeframe calculations.
• Calculates daily returns and annualizes the volatility using the square root of the time frame.
• Probability Computation:
• Employs a normal distribution CDF approximation to compute the probability of upward and downward price movements.
• Adjusts probabilities based on Z-Score to ensure accuracy.
• High and Low Projections:
• Utilizes the annualized volatility to estimate high and low price projections for the year.
• Visual Indicators and Alerts:
• Plots projected high (green) and low (red) levels on the chart.
• Displays Z-Score, probability percentages, and dynamically updates a statistics table.
Use Cases:
• Trend Analysis: Identify high-probability market movements using the probability metrics.
• Volatility Insights: Understand annualized volatility to gauge market risk and potential price ranges.
• Strategic Trading Decisions: Set alerts for high-probability scenarios to optimize entry and exit points.
Why Use “DataDoodles SD + Probability”?
This indicator provides a powerful combination of statistical analysis and visual representation. It empowers traders with:
• Quantitative Edge: By leveraging probability metrics and standard deviation, users can make informed trading decisions.
• Risk Management: Annualized volatility projections help in setting realistic stop-loss and take-profit levels.
• Actionable Alerts: Customizable probability alerts ensure users are notified of potential market moves, allowing proactive trading strategies.
Recommended Settings:
• Annualization Period: 252 (Ideal for daily data representing a trading year)
• SD Period: 252 (One trading year for consistent volatility calculations)
• Alert Probability: Set to 90% for conservative signals or lower for more frequent alerts.
Final Thoughts:
The “DataDoodles SD + Probability” indicator is a robust tool for traders looking to integrate statistical analysis into their trading strategies. It combines volatility measurement, probability calculations, and dynamic alerts to provide a comprehensive market overview.
Whether you’re a day trader or a long-term investor, this indicator can enhance your market insight and improve decision-making accuracy.
Disclaimer:
This indicator is a technical analysis tool designed for educational purposes. Past performance is not indicative of future results. Traders are encouraged to perform their own analysis and manage risk accordingly.
MTF- Standard Deviation ChannelWhat Is Standard Deviation?
Standard deviation is a statistical measurement that looks at how far individual points in a dataset are dispersed from the mean of that set. If data points are further from the mean, there is a higher deviation within the data set. It is calculated as the square root of the variance.
Key Takeaways:
Standard deviation measures the dispersion of a dataset relative to its mean.
It is calculated as the square root of the variance.
Standard deviation, in finance, is often used as a measure of the relative riskiness of an asset.
A volatile stock has a high standard deviation, while the deviation of a stable blue-chip stock is usually rather low.
Standard deviation is also used by businesses to assess risk, manage business operations, and plan cash flows based on seasonal changes and volatility.
Source: Investopedia
--------------- UPDATE ---------------
The deviation is calculated automatically. (via stdev function).
--
The targeted timeframe is available in the options (recalculation cycle).
--
If the selected security is a contract the number of days before expiration is automatically managed, otherwise it will use the 'default' options.
---------------------------------------

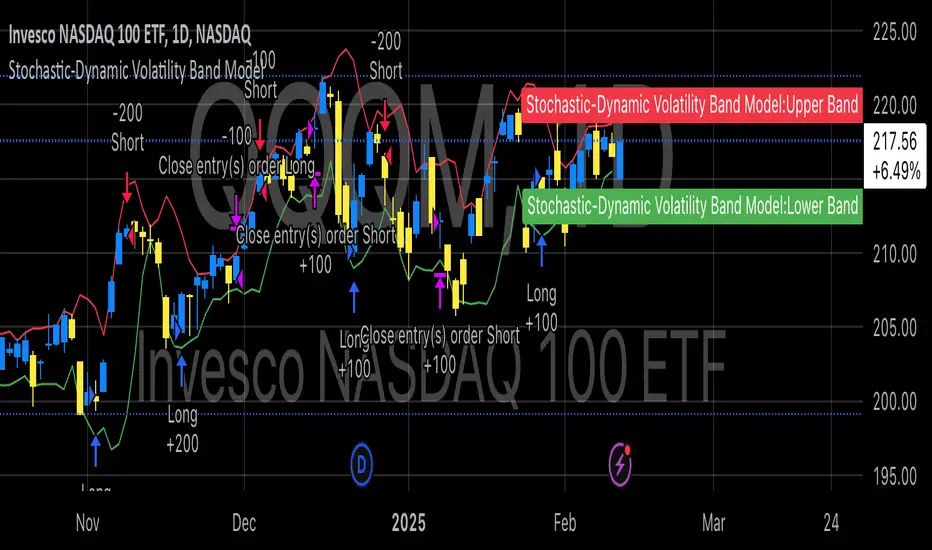
Stochastic-Dynamic Volatility Band ModelThe Stochastic-Dynamic Volatility Band Model is a quantitative trading approach that leverages statistical principles to model market volatility and generate buy and sell signals. The strategy is grounded in the concepts of volatility estimation and dynamic market regimes, where the core idea is to capture price fluctuations through stochastic models and trade around volatility bands.
Volatility Estimation and Band Construction
The volatility bands are constructed using a combination of historical price data and statistical measures, primarily the standard deviation (σ) of price returns, which quantifies the degree of variation in price movements over a specific period. This methodology is based on the classical works of Black-Scholes (1973), which laid the foundation for using volatility as a core component in financial models. Volatility is a crucial determinant of asset pricing and risk, and it plays a pivotal role in this strategy's design.
Entry and Exit Conditions
The entry conditions are based on the price’s relationship with the volatility bands. A long entry is triggered when the price crosses above the lower volatility band, indicating that the market may have been oversold or is experiencing a reversal to the upside. Conversely, a short entry is triggered when the price crosses below the upper volatility band, suggesting overbought conditions or a potential market downturn.
These entry signals are consistent with the mean reversion theory, which asserts that asset prices tend to revert to their long-term average after deviating from it. According to Poterba and Summers (1988), mean reversion occurs due to overreaction to news or temporary disturbances, leading to price corrections.
The exit condition is based on the number of bars that have elapsed since the entry signal. Specifically, positions are closed after a predefined number of bars, typically set to seven bars, reflecting a short-term trading horizon. This exit mechanism is in line with short-term momentum trading strategies discussed in literature, where traders capitalize on price movements within specific timeframes (Jegadeesh & Titman, 1993).
Market Adaptability
One of the key features of this strategy is its dynamic nature, as it adapts to the changing volatility environment. The volatility bands automatically adjust to market conditions, expanding in periods of high volatility and contracting when volatility decreases. This dynamic adjustment helps the strategy remain robust across different market regimes, as it is capable of identifying both trend-following and mean-reverting opportunities.
This dynamic adaptability is supported by the adaptive market hypothesis (Lo, 2004), which posits that market participants evolve their strategies in response to changing market conditions, akin to the adaptive nature of biological systems.
References:
Black, F., & Scholes, M. (1973). The Pricing of Options and Corporate Liabilities. Journal of Political Economy, 81(3), 637-654.
Bollinger, J. (1980). Bollinger on Bollinger Bands. Wiley.
Jegadeesh, N., & Titman, S. (1993). Returns to Buying Winners and Selling Losers: Implications for Stock Market Efficiency. Journal of Finance, 48(1), 65-91.
Lo, A. W. (2004). The Adaptive Markets Hypothesis: Market Efficiency from an Evolutionary Perspective. Journal of Portfolio Management, 30(5), 15-29.
Poterba, J. M., & Summers, L. H. (1988). Mean Reversion in Stock Prices: Evidence and Implications. Journal of Financial Economics, 22(1), 27-59.
STDEV Multi TimeFrame [Snowdex]STDEV Multi TimeFrame
The STDEV Multi TimeFrame indicator plots standard deviation levels (+1SD, +2SD, +3SD, -1SD, -2SD, -3SD) based on a user-selected timeframe (1D, 1W, 1M, etc.). It helps identify volatility, trend strength, and potential reversal zones using Bollinger Bands-style deviation calculations.
Key Features:
✅ Multi-Timeframe Selection – Choose any timeframe for STDEV calculations.
✅ Customizable Bollinger Bands – Select SMA, EMA, RMA, or WMA as the baseline.
✅ Color-Coded STDEV Levels – Fast (Green), Medium (Orange), Slow (Red).
✅ Non-Repainting & Accurate – Uses request.security() for precise data retrieval.
✅ Extended Lines & Labels – Clear trend monitoring with formatted values.
Use Cases:
📌 Detect trend direction & volatility.
📌 Identify overbought/oversold zones.
📌 Use as dynamic support/resistance levels.
🚀 Ideal for stocks, forex, crypto, and options trading! 🚀

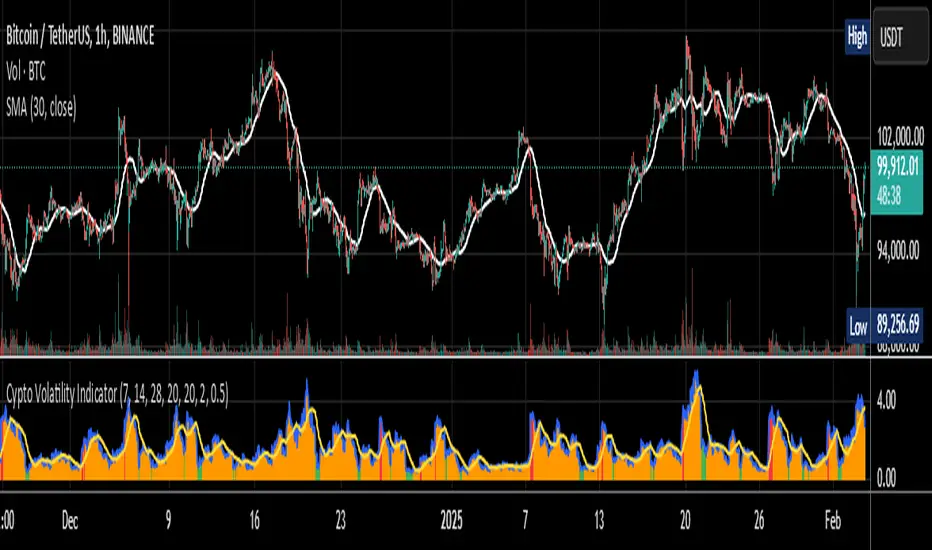
Cypto Oscillator with Sortino-like VolatilityEnhanced Inverted Ultimate Oscillator with Sortino-like Volatility
This indicator combines the power of the Ultimate Oscillator with a unique Sortino-like volatility calculation to provide a comprehensive view of market dynamics. It's designed to help traders identify potential turning points and assess the risk associated with price movements.
**Core Components:**
* **Ultimate Oscillator (UO):** The UO is a momentum indicator that incorporates short, medium, and long-term price action to identify overbought and oversold conditions. This indicator inverts and normalizes the UO to a 0-10 scale, providing a clear view of momentum shifts.
* **Sortino-like Volatility:** Instead of a standard deviation, this indicator uses a downside deviation calculation. This focuses specifically on *negative* price movements, offering a more relevant measure of risk for most traders. By not penalizing upside volatility, it avoids giving false signals during strong bull runs. The downside deviation is scaled as a percentage of the closing price for cross-asset comparability.
* **Volatility Signal:** The inverted UO is multiplied by the downside deviation to create a combined volatility signal. This signal reflects both momentum and downside risk, providing a more nuanced market perspective.
**Key Features and Uses:**
* **Identifying Potential Turning Points:** Divergences between the UO and price action can signal potential trend reversals. Look for the UO to make higher lows while price makes lower lows (bullish divergence) or the UO to make lower highs while price makes higher highs (bearish divergence).
* **Assessing Downside Risk:** The Sortino-like volatility component helps traders gauge the potential for downside price swings. Higher volatility suggests greater risk.
* **Dynamic Volatility Thresholds:** The indicator includes adjustable upper and lower volatility thresholds, based on a moving average of the volatility signal. These thresholds can be used to identify periods of unusually high or low volatility.
* **Customizable Lookback Periods:** Traders can adjust the lookback periods for the UO and the standard deviation calculation to fine-tune the indicator to their specific trading style and market conditions.
* **Visualizations:** The indicator provides several visual aids, including:
* A histogram of the volatility signal, colored dynamically based on its relationship to the moving average of volatility. Red indicates volatility above the upper bound, orange between the bounds and green below the lower bound.
* A line plot of the volatility signal.
* An optional moving average of the volatility signal.
* Optional upper and lower volatility threshold lines with a filled range for visual clarity.
* **Alerts:** The indicator includes alert conditions for when the volatility signal crosses above the upper threshold (high volatility) or below the lower threshold (low volatility).
**How to Use:**
1. **Inputs:** Adjust the input parameters to optimize the indicator for your chosen asset and timeframe.
2. **Divergences:** Look for divergences between the UO and price to identify potential trend reversals.
3. **Volatility:** Use the volatility signal and thresholds to assess downside risk.
4. **Alerts:** Enable alerts to be notified of high or low volatility events.
**Disclaimer:** This indicator is for informational purposes only and should not be considered financial advice. Always conduct your own thorough analysis before making any trading decisions.
Key improvements in this description:
Clear and concise language: Easy for traders to understand.
Focus on benefits: Highlights how the indicator can help traders.
Detailed explanation of features: Covers all the important aspects.
How-to-use section: Provides practical guidance.
Disclaimer: Includes a necessary disclaimer.
Emphasis on the Sortino-like approach: This is a unique selling point of your indicator.
Well-structured and formatted: Easy to read and digest.
This description should be a great starting point for sharing your indicator with the TradingView community. You can further customize it by adding screenshots of the indicator in action or linking to a chart where it's being used. Remember to respond to comments and questions from other users to build engagement and improve your indicator over time.
MOR+ [JJumbo]Midnight Opening Range (MOR)
Designed for opening range and ICT traders
- Midnight Opening Range Analysis
Accurate Price Benchmarking: Captures the essential price movements at the midnight
opening, providing a solid foundation for your trading decisions.
- RTH Candles Shadowing
Enhanced Visualization: Displays Regular Trading Hours (RTH) candle shadows, allowing you to
clearly see price fluctuations and trends during active trading periods.
- Standard Deviations
Incorporates standard deviation calculations to measure market
volatility, helping you identify potential breakout and reversal points with greater
confidence.
- Midnight Opening Price Reference
Strategic Entry Points: Highlights the midnight opening price, serving as a critical reference
level.
- Comprehensive Range Points Calculation Table
Detailed Analysis: Features a dynamic table that calculates and displays range points,
enabling you to track and analyze key price levels effortlessly.

Dynamic Volatility Differential Model (DVDM)The Dynamic Volatility Differential Model (DVDM) is a quantitative trading strategy designed to exploit the spread between implied volatility (IV) and historical (realized) volatility (HV). This strategy identifies trading opportunities by dynamically adjusting thresholds based on the standard deviation of the volatility spread. The DVDM is versatile and applicable across various markets, including equity indices, commodities, and derivatives such as the FDAX (DAX Futures).
Key Components of the DVDM:
1. Implied Volatility (IV):
The IV is derived from options markets and reflects the market’s expectation of future price volatility. For instance, the strategy uses volatility indices such as the VIX (S&P 500), VXN (Nasdaq 100), or RVX (Russell 2000), depending on the target market. These indices serve as proxies for market sentiment and risk perception (Whaley, 2000).
2. Historical Volatility (HV):
The HV is computed from the log returns of the underlying asset’s price. It represents the actual volatility observed in the market over a defined lookback period, adjusted to annualized levels using a multiplier of \sqrt{252} for daily data (Hull, 2012).
3. Volatility Spread:
The difference between IV and HV forms the volatility spread, which is a measure of divergence between market expectations and actual market behavior.
4. Dynamic Thresholds:
Unlike static thresholds, the DVDM employs dynamic thresholds derived from the standard deviation of the volatility spread. The thresholds are scaled by a user-defined multiplier, ensuring adaptability to market conditions and volatility regimes (Christoffersen & Jacobs, 2004).
Trading Logic:
1. Long Entry:
A long position is initiated when the volatility spread exceeds the upper dynamic threshold, signaling that implied volatility is significantly higher than realized volatility. This condition suggests potential mean reversion, as markets may correct inflated risk premiums.
2. Short Entry:
A short position is initiated when the volatility spread falls below the lower dynamic threshold, indicating that implied volatility is significantly undervalued relative to realized volatility. This signals the possibility of increased market uncertainty.
3. Exit Conditions:
Positions are closed when the volatility spread crosses the zero line, signifying a normalization of the divergence.
Advantages of the DVDM:
1. Adaptability:
Dynamic thresholds allow the strategy to adjust to changing market conditions, making it suitable for both low-volatility and high-volatility environments.
2. Quantitative Precision:
The use of standard deviation-based thresholds enhances statistical reliability and reduces subjectivity in decision-making.
3. Market Versatility:
The strategy’s reliance on volatility metrics makes it universally applicable across asset classes and markets, ensuring robust performance.
Scientific Relevance:
The strategy builds on empirical research into the predictive power of implied volatility over realized volatility (Poon & Granger, 2003). By leveraging the divergence between these measures, the DVDM aligns with findings that IV often overestimates future volatility, creating opportunities for mean-reversion trades. Furthermore, the inclusion of dynamic thresholds aligns with risk management best practices by adapting to volatility clustering, a well-documented phenomenon in financial markets (Engle, 1982).
References:
1. Christoffersen, P., & Jacobs, K. (2004). The importance of the volatility risk premium for volatility forecasting. Journal of Financial and Quantitative Analysis, 39(2), 375-397.
2. Engle, R. F. (1982). Autoregressive conditional heteroskedasticity with estimates of the variance of United Kingdom inflation. Econometrica, 50(4), 987-1007.
3. Hull, J. C. (2012). Options, Futures, and Other Derivatives. Pearson Education.
4. Poon, S. H., & Granger, C. W. J. (2003). Forecasting volatility in financial markets: A review. Journal of Economic Literature, 41(2), 478-539.
5. Whaley, R. E. (2000). The investor fear gauge. Journal of Portfolio Management, 26(3), 12-17.
This strategy leverages quantitative techniques and statistical rigor to provide a systematic approach to volatility trading, making it a valuable tool for professional traders and quantitative analysts.

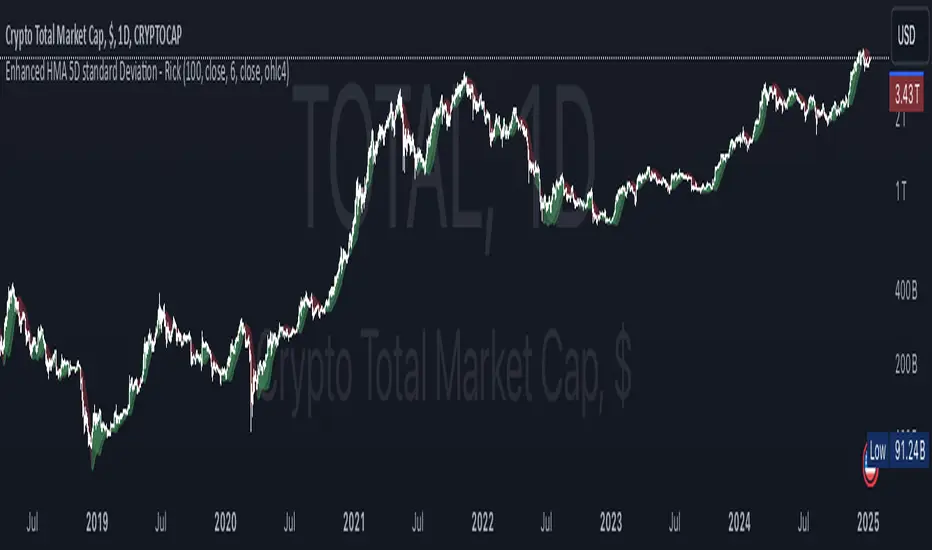
Enhanced HMA 5D standard Deviation - RickSimple hull moving average enhanced with standard deviation bands calculated over a 5 day period to account for volatility in ranging periods.
Possibility to choose the source of the hull calculation, as well as the source to use as threshold for long and short signal.
Two different types of visualization: candle coloring or moving average.
Prime Bands [ChartPrime]The Prime Standard Deviation Bands indicator uses custom-calculated bands based on highest and lowest price values over specific period to analyze price volatility and trend direction. Traders can set the bands to 1, 2, or 3 standard deviations from a central base, providing a dynamic view of price behavior in relation to volatility. The indicator also includes color-coded trend signals, standard deviation labels, and mean reversion signals, offering insights into trend strength and potential reversal points.
⯁ KEY FEATURES AND HOW TO USE
⯌ Standard Deviation Bands :
The indicator plots upper and lower bands based on standard deviation settings (1, 2, or 3 SDs) from a central base, allowing traders to visualize volatility and price extremes. These bands can be used to identify overbought and oversold conditions, as well as potential trend reversals.
Example of 3-standard-deviation bands around price:
⯌ Dynamic Trend Indicator :
The midline of the bands changes color based on trend direction. If the midline is rising, it turns green, indicating an uptrend. When the midline is falling, it turns orange, suggesting a downtrend. This color coding provides a quick visual reference to the current trend.
Trend color examples for rising and falling midlines:
⯌ Standard Deviation Labels :
At the end of the bands, the indicator displays labels with price levels for each standard deviation level (+3, 0, -3, etc.), helping traders quickly reference where price is relative to its statistical boundaries.
Price labels at each standard deviation level on the chart:
⯌ Mean Reversion Signals :
When price moves beyond the upper or lower bands and then reverts back inside, the indicator plots mean reversion signals with diamond icons. These signals indicate potential reversal points where the price may return to the mean after extreme moves.
Example of mean reversion signals near bands:
⯌ Standard Deviation Scale on Chart :
A visual scale on the right side of the chart shows the current price position in relation to the bands, expressed in standard deviations. This scale provides an at-a-glance view of how far price has deviated from the mean, helping traders assess risk and volatility.
⯁ USER INPUTS
Length : Sets the number of bars used in the calculation of the bands.
Standard Deviation Level : Allows selection of 1, 2, or 3 standard deviations for upper and lower bands.
Colors : Customize colors for the uptrend and downtrend midline indicators.
⯁ CONCLUSION
The Prime Standard Deviation Bands indicator provides a comprehensive view of price volatility and trend direction. Its customizable bands, trend coloring, and mean reversion signals allow traders to effectively gauge price behavior, identify extreme conditions, and make informed trading decisions based on statistical boundaries.
