Mean Absolute Deviation BandsThe other way to build bands around price that uses Mean Absolute Deviation instead of Standard Deviation.
MAD is also a measure of variability, but less frequently used. MAD is better for use with distributions other than the Gaussian.
MAD is always less than or equal to Standard Deviation and the resulting bands are more tighter for the same parameters if we compare it to Bollinger Bands.
If you use band stops this can be useful.
標準偏差

VWAP y Standar DeviationThis script presents the real VWAP (Yellow line), in 50 period VWAP (Blue Line) and the 120 period VWAP (Red Line). Additionally, it presents the values of 1 and 1,618 standard deviations of the VWAP of 50 periods.
This confirmation allows to visualize the behavior of the price in realicon to the VWAP key indicator that represents the midpoint of the operating volumes in a period.
This script evaluates the deviation of the price in relation to the average of the volume traded in the different periods.
The indicator settings allow changing the length of the VWAP for custom settings. Standard deviations are determined based on VWAP 2. VWAP 1 is a reference for determining the global trend of movement in the established period.
The upper and lower limits of the representative Standard Deviation of 1.618 (Fibonacci Number) are used as confirmation of continuation of a trend once crossed by the price.
During the ranges the 1.618 limits of the Dev. Standard are used as entry and exit points of the operation (For this it is necessary to adjust the VWAP 2 to the studied temporality and the operated asset)

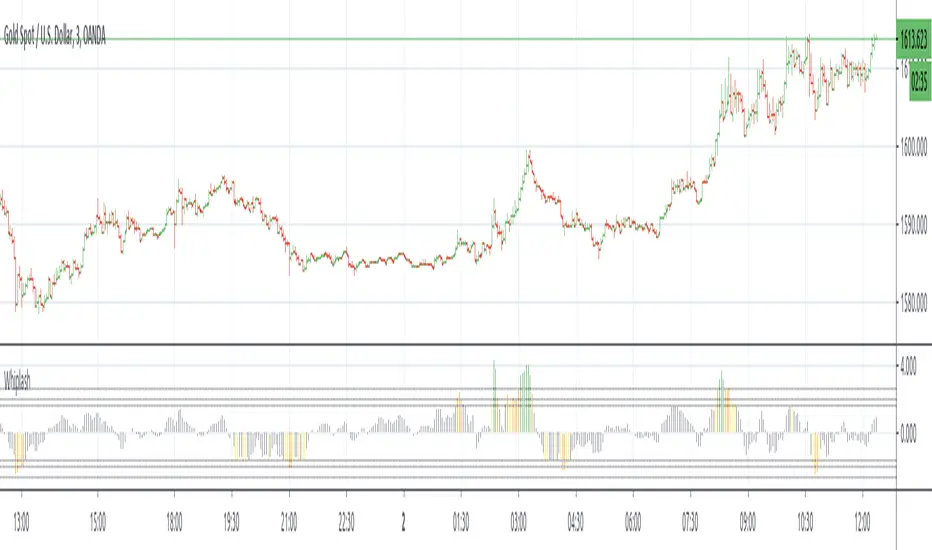
WhipLashThis is a study to determine if small candle bodies (little difference between open and close), regardless of overall candle length (high/low), can be used to filter choppy markets.
The indicator will calculate the selected average "MA Mode" of (close-open). To standardize this result and ensure any filters/thresholds do not need to be recalculated for each instrument the result will be used to calculate the Z Score.
The idea is that when candle bodies are small there is very little actual price movement, and therefore price is choppy. When considering the Z Score of that result, any outliers ie larger candle bodies, could show a potential trend forming. This indicator is similar to QStick but allows more customization by the user.
MA Mode determines which MA is used to smooth the results of (close-open)
Price Smoothing is the number of running periods the MA Mode is calculated for.
The three Thresholds are preset to the 90%, 95%, and 99% levels for Z Score. If these thresholds are altered you may wish to also alter the horizontal lines programmed for each level on the positive and negative sides.
The Z Length is the period for which the Z Score is calculated
Multiple MA Options Credits to @Fractured
Bits and Pieces from @AlexGrover, @Montyjus, and @Jiehonglim
As always, trade at your own risk.
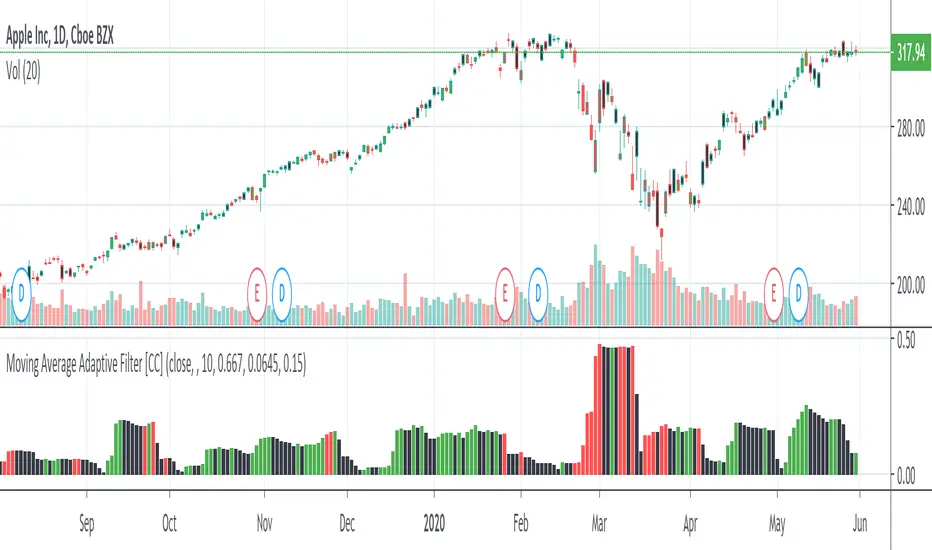
Moving Average Adaptive FilterThe Moving Avg Adaptive Filter (MAAF) was authored by Perry Kaufman in the Stocks and Commodities Magazine 03/1998
This is a volatility based indicator so when this indicator goes up, sell in the direction of how that stock is going. In other words go short when it is rising and the stock price is below the ema or go long when it is rising and the stock price is above the ema. Lower volatility means it is trading sideways or the current price action is about to reverse.
Send me a message and let me know what other indicators you would like to see!
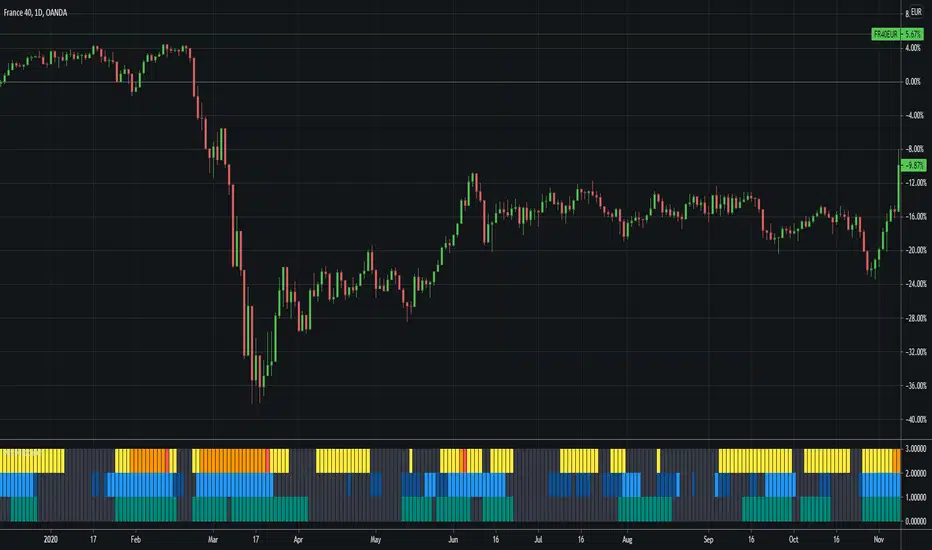
VQZL Z-ScoreVolatility Qaulity Zero Line attempts to keep a trader out of ranging markets, but the original calculation on TradingView had to be adjusted for each instrument. To avoid this issue, I have applied a z-score calculation to the VQZL so the result is standardized for all instruments. A Z-Score is simply a value's relationship to the mean (average) of a group of values, measured in terms of standard deviations from the mean.
This calculation allows us to compare current volatility to the mean (moving average) of the population (Z-Length). The closer the VQZL Z-Score is to the mean, the closer it will be to the Zero Line and therefore price is likely consolidating and choppy. The farther VQZL Z-Score is from the mean, the more likely price is trending.
The MA Mode determines the Moving Average used to calculate VQZL itself. The Z-Score is ALWAYS calculated with a simple moving average (as that is the standard calculation for Z-Score).
The Threshold Levels are the levels at which VQZL Z-Score will change from gray to yellow, orange, green (bullish), or red (bearish). These levels can be adjusted but you should adjust the Threshold Lines as well (in the style section), so they line up with your adjusted values.
Statistically speaking, confidence levels in relation to Z-Score are noted below. The built in Threshold Levels are the positive and negative values for 90%, 95%, and 99%. This would indicate when volatility is greater than these values they are out of the ordinary from the standard range. You may wish to adjust these levels for VQZL Z-Score to be more responsive to your trading need
80% :: 1.28
85% :: 1.44
90% :: 1.64
95% :: 1.96
99% :: 2.58
As always, trade at your own risk.
VQZL Created by Investo And Adapted From @sarangab
Multiple MA Options Credits to @Fractured
Bits and Pieces from @AlexGrover and @Montyjus

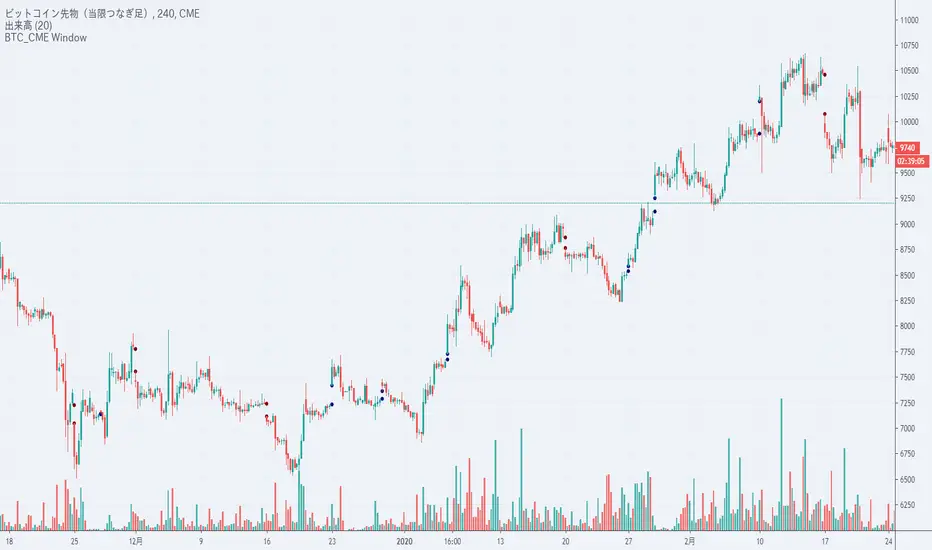
BTC_CME WindowThis indicator locates gaps created by the CME Futures market for Bitcoin .
As you can see, Bitcoin tends to close the gaps created in the futures market so I thought this could be a very useful tool.
ビットコインCME(先物取引)でのチャートギャップの窓を表示します。
複数のチャートを切り替える事なく、インジケータでの窓埋め確認が可能です。
Standard Deviation Measurement ToolIf you like the script please come back and leave me a comment or find me on the interwebs. I get notified you "liked" it... but I have no idea if you actually use it. So, let me know =)
The script uses the open price as the mean and calculates the standard deviation from the open price on a per candle basis
- Goal: -
To establish a mean based on the Open Price and calculate the standard deviation.
The reason for this is if the Open is the mean, then the Standard deviation implies a standardized distance a given candle can be expected to travel
from the open price
- Edge: -
If you know that there is a 68%/95%/99.7% probability that price will NOT move more than
One Standard Deviation/Two Standard Deviations/Three Standard Deviations from the open price respectively
you can set reasonable price targets that relate to those probabilities in a given timeframe.
e.g. if you're on a 1h chart and your target is 3.5% from the open price, but 1 standard deviation of the hourly candle is equal to 0.78%.
You can make assumptions on either:
- The reasonableness of your target
or
- The holding period likely required for the trade.
Also, Standard Deviation is a function of volatility and this tool provides a unique mechanism for measuring volatility as well on a candle by candle basis
- Customization Options-
- Set 3 independent upper and lower standard deviations.
- Each set of standard deviations are on a switch so you can show 1, 2, or 3 sets of standard deviations
- You can set the distribution width
- Though it's not recommended, you can change the mean source.
- There is a switch to show the standard deviation on only the real-time bar or real-time and historical bars.
- How I Think About This Script -
This strategy is predicated the same principle as Bollinger Bands: the reality that 68% of all data points will fall within one standard deviation of the mean, 96% of all data points will fall within two standard deviations, and 98% of al data points will fall within 3 standard deviations. By understanding the standard deviation, you can possibly infer an edge by understanding the probabilistic range price will be bound to the limits of standard deviation rules according to their probabilistic outcomes for the single candle on any given timeframe. Bollinger Bands are designed to provide this information with the mean being a 20-period moving average and this indicator.
This indicator is designed to provide standard deviation information with the mean being based on the distance price travels away from the open of individual candles in the lookback period.
If you use a strategy where you enter on major candle closes, this can be useful to set targets for those entries based on the intended hold period or at least add/remove validity to other target metrics.
Example:
Your target is at the 1.618 Fibonacci level and your confirmation triggers on the 4h candle close (H4 if that's your thing lol). You set up the indicator based on the standard deviation of price movement in 4h candles over the last week.
Let's say the indicator shows that the 1.618 Fibonacci level is 3 standard deviations away.
This being the case this statistically indicates that within the next 4 hours, you have a very low probability of achieving your target (>2%). This doesn't invalidate your target, but it does indicate a low probability of achieving it in the next 4hrs. With this information, you can infer that you are either going to be (a) really lucky (b) in this trade for a lot longer than 4hrs or (c) your target is unrealistic given your intended hold period.
You can develop a more probabilistically favorable hold period calculation by looking at the standard deviation on a higher time frame (e.g. 1d-1w).
Bonus feature: You'll find that the 2 and 3 standard deviations will often "cluster" and these clusters often provide future S/R levels. That's a pretty sweet feature no one things to look for. But, try it. Find a cluster of 2nd and 3rd stdevs that are in somewhat of a horizontal pattern (usually the result of a range) and you'll find that to be a good s/r area. Even better if you use the 3.2 standard deviation, you'll find that is a fantastic breakout signal!
Summary
So, you can use it for target setting, a confluence test, a reasonableness test, or just a measurement tool.
This was the first TV script I ever wrong.. Got taken down. But, I've re-released it because there are other TV scripts that attempt to do this but are completely wrong.
Please be careful about using other people's scripts. Always validate the math of the script before you use it if possible.
Stay safe out there and I hope all your dreams come true.

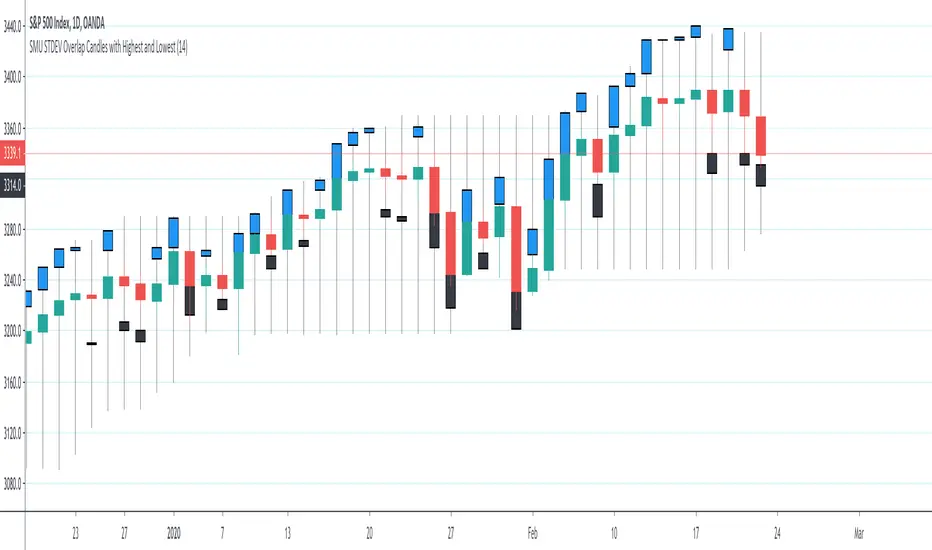
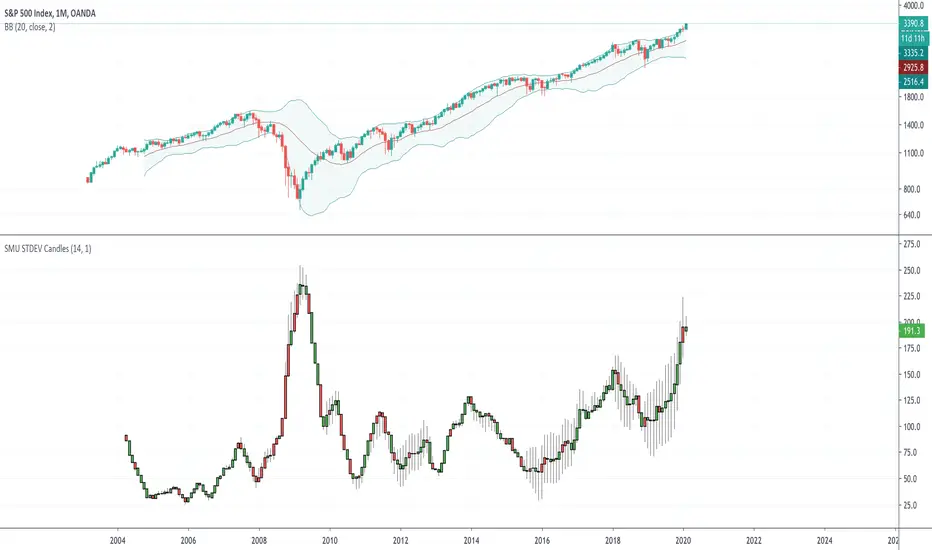
SMU STDEV Overlap Candles with Highest and Lowest
This script creates a STDEV in a candle format overlayed on the actual candles. The STDEV candles lead with deviation to upside or downside.
The Blue bars are Upside heads-up showing the strength of the uptrend before it happens.
The Black candles are downside indicators pulling on the price
I like price action because it is raw. So for High and Low I used the highest and lowest amount so when you trade you can see where the price is in relation to previous high and low
I use this script in conjunction with my first STDEV candles to get the full picture in short time frames. For example, when I see the STDEV of above 6 on change of direction then I trade on it before the trend begins and confirm it with STDEV overlay
If you have you been following my scripts you notice the code is very simple but the concept is very powerful. My hope is better pine script coders to build on these scripts and publish more out of the box type of scripts.
Enjoy
SMU STDEV Candles This script creates a STDEV in a candle format so you can see the Change in a candle format and compare it with the actual price candle.
Is very similar to SMU RSI and SMU ROC. The interesting part is to see the full effect of traditional indicators in a candle format rather than a simple plot format. Very interesting view in SPX. There is a very big clue in the chart as STDEV changed since 2008. Can you figure it out?
Also, try this in lower time frame and you will be amazed how Algo kills volatility after each upside or downside. Fascinating
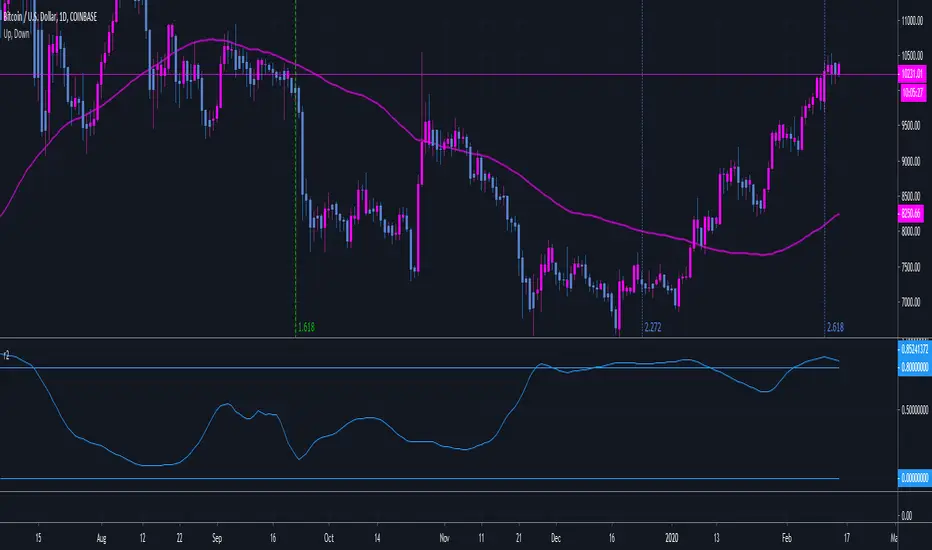
r2 correlation coefficientmade a quick script to compare r2 correlation coefficient, can change source and correlation component in inputs menu
example, here we can see that btc currently has a 0.85 correlation with eth vs usd when using simple moving avg on the daily (above 0.8 is positive correlation. below -0.8 is negitive correlation, and anything in between means there is no correlation)
note: if you wanted to compare with a different source like rsi, then you would need to reduce the length in the inputs menu
not an expert, i encourage doing your own research
biffy
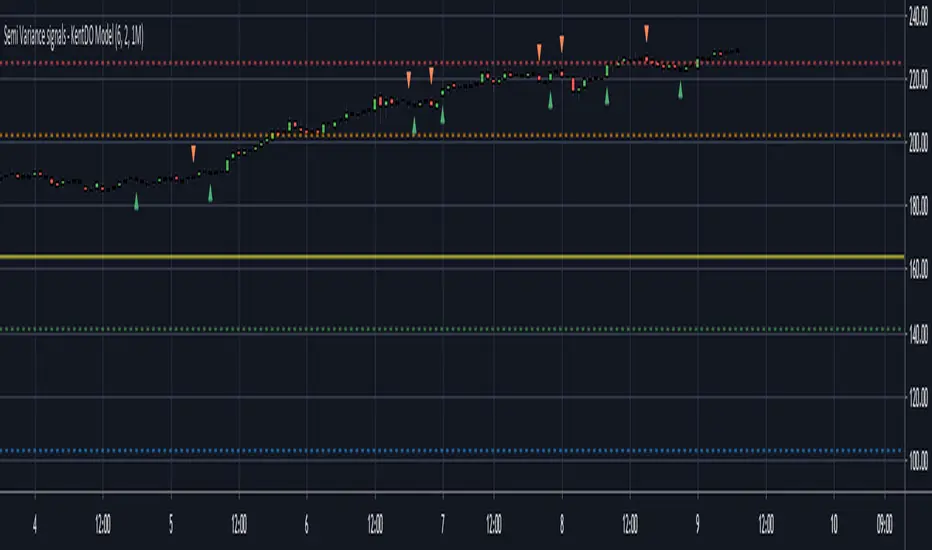
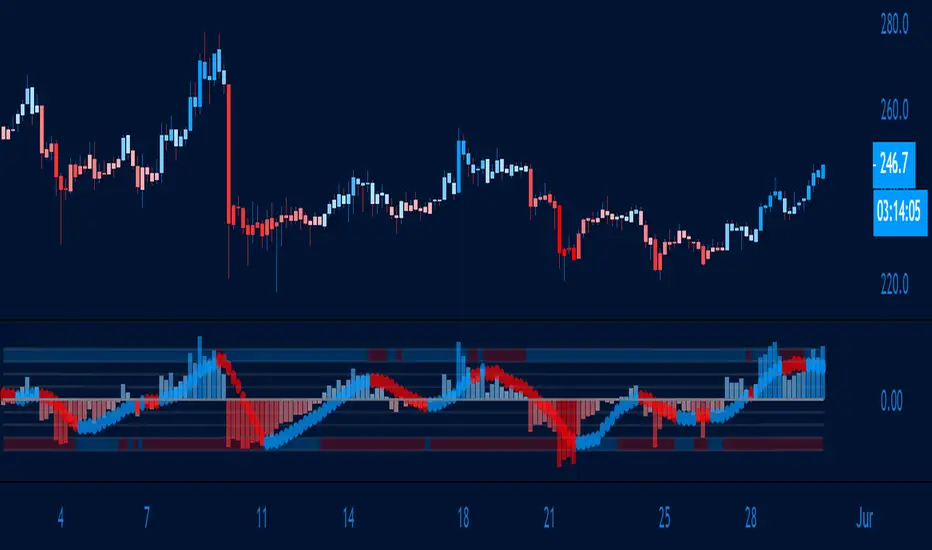
Semi Variance signals - KentDO ModelThe indicator generated by measuring the difference in yield volatility in two directions up and down, is called a Semi-measure of risk. A change in the sign of the difference between two halves of volatility produces a buy and sell signal.
The indicator can customize the number of observations.
The indicator adds reference Pivot Point level points for a larger time frame. Can edit the number of decimals, so suitable for Indices, Curencies, Futures, Crypto, Bonds
sma dipsparity and sdvFXBTCJPY 1min contrarian script (2020/1/30)
1分足の逆張りです.
If you want to use other timescale, need to change disparity rate and sdv.
To display disparity(sma) and standard deviation, and to draw a hline(pine function) a certain valu. And lets think. I thought disparity rate 1~1.3 or -1~-1.3 are able to use constrarian trade (and sdv>600).
In bottom, disparity index is auxiliary. It is different from the multiple in the script to make the value easier to understand.
Sorry if the expiration date of the script has expired.

Pair Trade cryptoPair trade for crypto with inputs:
* length of correlation and moving average
* trade pair
* spread threshold to enter long / short
* spread threshold to exit long / short
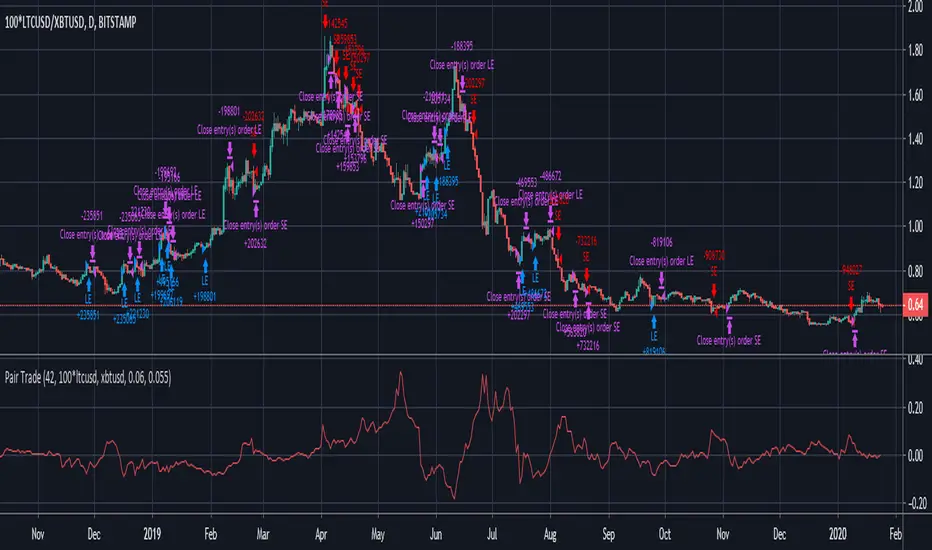
Pair TradePair trade with inputs:
* length of correlation and moving average
* trade pair
* spread threshold to enter long / short
* spread threshold to exit long / short

Bollinger Band BreakoutIt is a long only strategy.
1. Buy when price breaks out of the upper band.
2. Exit has two options. Option 1 allows you to exit using lower band. Option 2 allows you to exit using moving average.
3. Option 1 preferred over option 2 if the instrument is highly volatile.
4. Slippage and commissions are not considered in the return calculation.

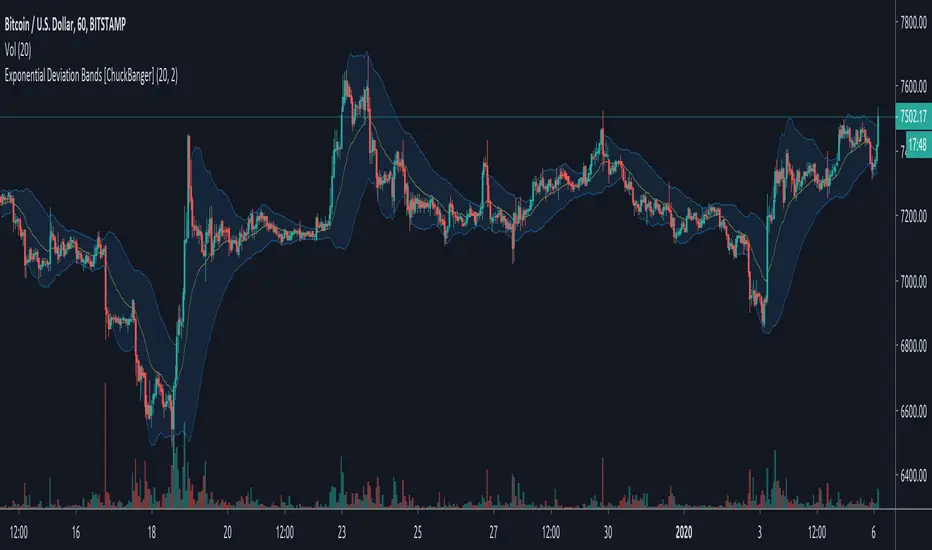
Exponential Deviation Bands [ChuckBanger]This is Exponential Deviation Bands. It is a price band indicator based on exponential deviation rather than the more traditional standard deviation, as you find in the well-known Bollinger Bands calculation. As compared to standard deviation bands, exponential deviation bands apply more weight to recent data and generate fewer breakouts. There fore it is a much better tool to identifying trends.
One strategy on the daily can be
Buy next bar if closing price crosses below the lower bands
Sell if price is equal to the current value of the upper bands
ACTION Locator v2.0The indicator is based on making the standard deviation (where the mean is a moving average) a two-lines cross indicator, by applying an MA over it. When the standard deviation is above the MA, there is considered to be enough volatility in the market for trends to form.
Blue background = There is ACTION in the market -- signals it should be safe to trade
Gray background = No ACTION - DO NOT TRADE!
[SignalFI] AxLeWelcome! Proud to release AxLe! The indicator which provides a trend-based analysis based on volatility, deviations bands, and price momentum. The basis behind AxLe is to essentially give an oscillator view of the difference between key price deviations based on volatility and volume information. The oscillator provides candle coloring matching the scaled colors of the strength of the trend, while the oscillator itself provides key information such as signal line crossovers, baseline crossovers, and AxLe MACD statistics. Taken together, it provides an excellent view of the trend without using moving averages, and well as a way to spot momentum variance and price divergences.
Features:
1) Price/Volume (PV) volatility oscillator based on fractal deviation bands
2) PV signal line to denote PV trend
3) Top/Bottom oscillator horizontal bar color changes based on PV/Signal Line crossovers.
4) Bar coloring to match oscillator performance.
5) Alerts for PV critical levels.
Alerts:
1) Bull Signal X - PV Crossover Signal Line
2) Bear Signal X - PV Crossunder Signal Line
3) Bull Baseline X - PV Crossover Zero Line
4) Bear Baseline X - PV Crossunder Zero Line
USAGE:
1) Follow the color trend
2) User oscillator highs and lows to spot divergences with price highs and lows
3) User PV line and signal line (circles) as indicators for trend change
4) Use Top/Bottom oscillator horizontal bar color changes to indicate tops and bottoms or where momentum is becoming weak.
5) User predefined alerts.
SignalFI was created to help traders and investors to effectively analyze the market based on the Golden Mean Ratio (Fibonacci numbers), plan a trade and ultimately execute it. To help inform and educate market decisions we developed a set of Trading Indicators which are available on TradingView.
SignalFI indicators are just that, indicators. Our indicators are generally configured to use completely historical data (negating repaint), and we advise all alerts created with SignalFI indicators to be fired upon "close" of the current candle. Our indicators can provide valuable context and visualization support when performing market analysis and executing buy and sell decisions. However. we are not financial experts, and all information presented on this site or our other media outlets are for educational purposes only.
TD Moon Cycle Standard Deviation Z Score AlertsHas alerts for the TD 9 function, also the black is Z score and blue is STD Dev
Also the moon functionality of Ichimoonku is built into this as well because sometimes I just want to see the cycles of moon with TD9 ; see that script (Ichimoonku) for more info on moon functionality.
Much love
Enjoy
GL HF
xoxo
Snoop

AEONDRIFT {Expected Ranges}Expected Ranges base on AEONDRIFT implementation of Standard Deviation bands.
Note: In no way is this intended as a financial/investment/trading advice. You are responsible for your own investment/trade decisions.
Please PM me for access information.

Variable Index Dynamic Average (VIDYA) BandsThis adds volatility bands to the Variable Index Dynamic Average (VIDYA). The bands are calculated using the exponential moving average of the standard deviation of the VIDYA.
Thanks to everget for programming the VIDYA for tradingview.

Bollinger Bands Width 10標準偏差Standard Deviation(bolliger bands width)を10本重ねたものになります。お好みのスパン、色、σでお使いください。

AEONDRIFT-KThis is a special edition of the AEONDRIFT Band that is implemented in my Strategies , which have substantially boosted their profitability.
Squeeze Zone = Increase chance for a big move to happen. I used this to decrease (buy/sell) trading thresholds in my strategy scripts to increase the chances of making a trade.
No Trading Zone = Increase chances for bad trades due to difficulty for indicators to . As the name implies, I used this to disable trading completely during this period.
Alerts are enabled for these states.
~ * ~ * ~ * ~ * ~ * ~ * ~ * ~ * ~ * ~ * ~ * ~ * ~ * ~ * ~ * ~ * ~ * ~ * ~ * ~ * ~
Note:
In no way is this intended as a financial/investment/trading advice. You are responsible for your own investment decisions and trades.
Please exercise your own judgement for your own trades base on your own risk-aversion level and goals as an investor or a trader. The use of OTHER indicators and analysis in conjunction (tailored to your own style of investing/trading) will help improve confidence of your analysis, for you to determine your own trade decisions.
~ * ~ * ~ * ~ * ~ * ~ * ~ * ~ * ~ * ~ * ~ * ~ * ~ * ~ * ~ * ~ * ~ * ~ * ~ * ~ * ~
Please check out my other indicators sets and series, e.g.
LIVIDITIUM (dynamic levels),
AEONDRIFT (multi-levels standard deviation bands),
FUSIONGAPS (MA based oscillators),
MAJESTIC (Momentum/Acceleration/Jerk Oscillators),
PRISM (pSAR based oscillator, with RSI/StochRSI as well as Momentum/Acceleration/Jerk indicators),
PDF (parabolic SAR /w HighLow Trends Indicator/Bar-color-marking + Dynamic Fib Retrace and Extension Level)
and more to come.
Constructive feedback and suggestions are welcome.
~ JuniAiko
(=^~^=)v~
AEONDRIFT
Strategy Scripts:
Cyber Momentum Strategy
Cyber Ensemble Strategy
See Also: Relative Candle Volatility & Directionality Index (RCVI and RCDI)
