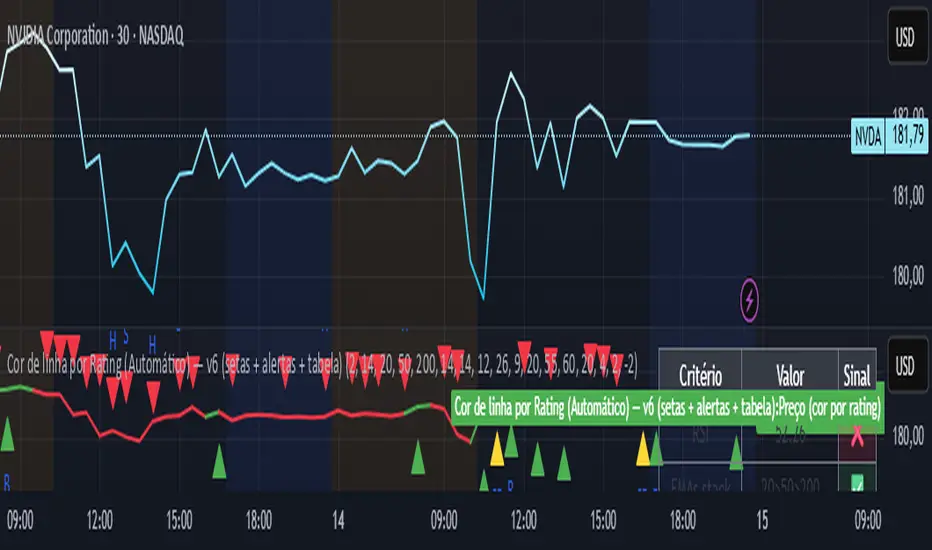
Line color best indices grouped by Artificial Intelligence
The script uses the best buy indicators, such as moving average crossovers, RSI, and others selected by AI. The idea is to determine whether the stock is classified as a strong buy (yellow line), a buy (green line), or a red (sell)
Statistics
XAUUSD Strength Dashboard with VolumeXAUUSD Strength Dashboard with Volume Analysis
📌 Description
This advanced Pine Script indicator provides a multi-timeframe dashboard for XAUUSD (Gold vs. USD), combining price action analysis with volume confirmation to generate high-probability trading signals. It detects:
✅ Break of Structure (BOS)
✅ Fair Value Gaps (FVG)
✅ Change of Character (CHOCH)
✅ Trendline Breaks (9/21 SMA Crossover)
✅ Volume Spikes (Confirmation of Strength)
The dashboard displays strength scores (0-100%) and action recommendations (Strong Buy/Buy/Neutral/Sell/Strong Sell) across multiple timeframes, helping traders identify confluences for better trade decisions.
🎯 How It Works
1. Multi-Timeframe Analysis
Fetches data from 1m, 5m, 15m, 30m, 1h, 4h, Daily, and Weekly timeframes.
Compares trend direction, BOS, FVG, CHOCH, and volume spikes across all timeframes.
2. Volume-Confirmed Strength Score
The Strength Score (0-100%) is calculated using:
Trend Direction (25 points) → 9 SMA vs. 21 SMA
Break of Structure (20 points) → New highs/lows with momentum
Fair Value Gaps (10 points) → Imbalance zones
Change of Character (10 points) → Shift in market structure
Trendline Break (20 points) → SMA crossover confirmation
Volume Spike (15 points) → High volume confirms moves
Score Interpretation:
≥75% → Strong Buy (High confidence bullish move)
60-74% → Buy (Bullish but weaker confirmation)
40-59% → Neutral (No strong bias)
25-39% → Sell (Bearish but weaker confirmation)
≤25% → Strong Sell (High confidence bearish move)
3. Dashboard & Chart Markers
Dashboard Table: Shows Trend, BOS, Volume, CHOCH, TL Break, Strength %, Key Level, and Action for each timeframe.
Chart Markers:
🟢 Green Triangles → Bullish BOS
🔴 Red Triangles → Bearish BOS
🟢 Green Circles → Bullish CHOCH
🔴 Red Circles → Bearish CHOCH
📈 Green Arrows → Bullish Trendline Break
📉 Red Arrows → Bearish Trendline Break
"Vol↑" (Lime) → Bullish Volume Spike
"Vol↓" (Maroon) → Bearish Volume Spike
🚀 How to Use
1. Dashboard Interpretation
Higher Timeframes (D/W) → Show the dominant trend.
Lower Timeframes (1m-4h) → Help with entry timing.
Strength Score ≥75% or ≤25% → Look for high-confidence trades.
Volume Spikes → Confirm breakouts/reversals.
2. Trading Strategy
📈 Long (Buy) Setup:
Higher TFs (D/W/4h) show bullish trend (↑).
Current TF has BOS & Volume Spike.
Strength Score ≥60%.
Key Level (Low) holds as support.
📉 Short (Sell) Setup:
Higher TFs (D/W/4h) show bearish trend (↓).
Current TF has BOS & Volume Spike.
Strength Score ≤40%.
Key Level (High) holds as resistance.
3. Customization
Adjust Volume Spike Multiplier (Default: 1.5x) → Controls sensitivity to volume spikes.
Toggle Timeframes → Enable/disable higher/lower timeframes.
🔑 Key Benefits
✔ Multi-Timeframe Confluence → Avoids false signals.
✔ Volume Confirmation → Filters low-quality breakouts.
✔ Clear Strength Scoring → Removes emotional bias.
✔ Visual Chart Markers → Easy to spot key signals.
This indicator is ideal for gold traders who follow institutional order flow, market structure, and volume analysis to improve their trading decisions.
🎯 Best Used With:
Support/Resistance Levels
Fibonacci Retracements
Price Action Confirmation
🚀 Happy Trading! 🚀


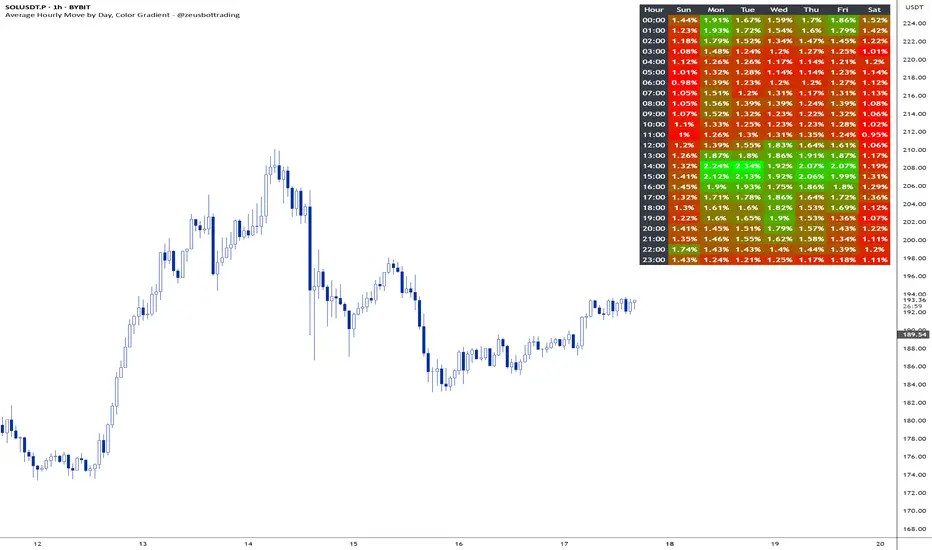
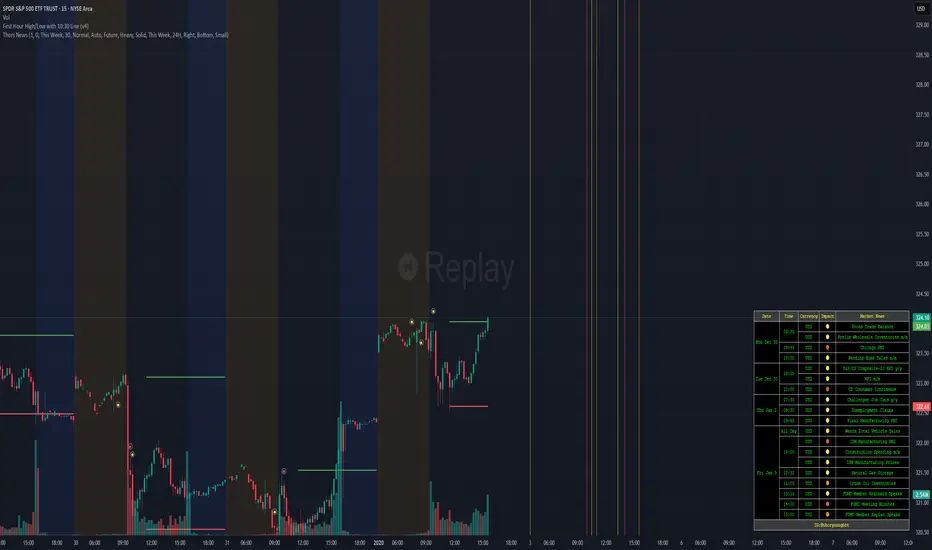
Average hourly move by @zeusbottradingThis Pine Script called "Average hourly move by @zeusbottrading" calculates and displays the average percentage price movement for each hour of the day using the full available historical data.
How the script works:
It tracks the high and low price within each full hour (e.g., 10:00–10:59).
It calculates the percentage move as the range between high and low relative to the average price during that hour.
For each hour of the day, it stores the total of all recorded moves and the count of occurrences across the full history.
At the end, the script computes the average move for each hour (0 to 23) and determines the minimum and maximum averages.
Using these values, it creates a color gradient, where the hours with the lowest average volatility are red and the highest are green.
It then displays a table in the top-right corner of the chart showing each hour and its average percentage move, color‑coded according to volatility.
What it can be used for:
Identifying when the market is historically most volatile or calm during the day.
Helping plan trade entries and exits based on expected volatility.
Comparing hourly volatility patterns across different markets or instruments.
Adjusting position size and risk management according to the anticipated volatility in a particular hour.
Using long-term historical data to understand recurring daily volatility patterns.
In short, this script is a useful tool for traders who want to fine‑tune their trading strategies and risk management by analyzing time‑based volatility profiles.
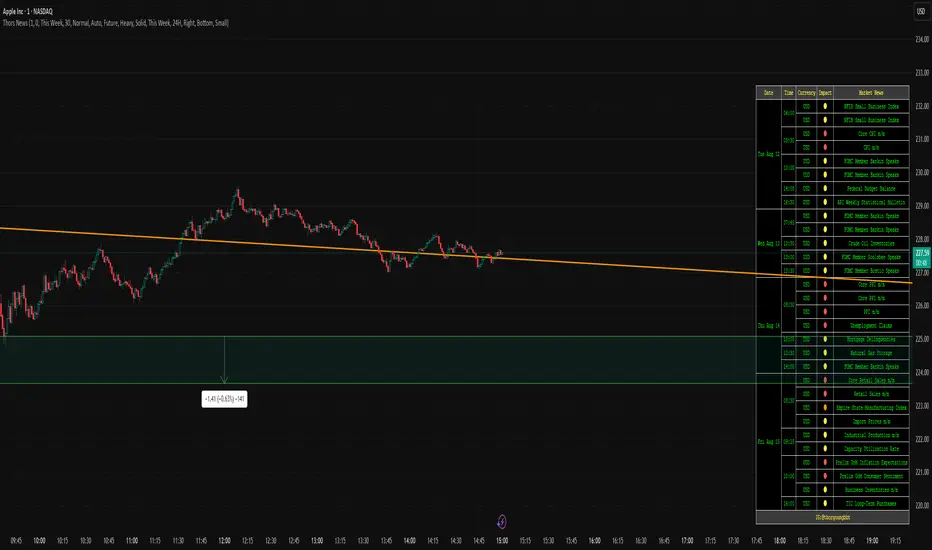
Awesome Indicator# Moving Average Ribbon with ADR% - Complete Trading Indicator
## Overview
The **Moving Average Ribbon with ADR%** is a comprehensive technical analysis indicator that combines multiple analytical tools to provide traders with a complete picture of price trends, volatility, relative performance, and position sizing guidance. This multi-faceted indicator is designed for both swing and positional traders looking for data-driven entry and exit signals.
## Key Components
### 1. Moving Average Ribbon System
- **4 Customizable Moving Averages** with default periods: 13, 21, 55, and 189
- **Multiple MA Types**: SMA, EMA, SMMA (RMA), WMA, VWMA
- **Color-coded visualization** for easy trend identification
- **Flexible configuration** allowing users to modify periods, types, and colors
### 2. Average Daily Range Percentage (ADR%)
- Calculates the average daily volatility as a percentage
- Uses a 20-period simple moving average of (High/Low - 1) * 100
- Helps traders understand the stock's typical daily movement range
- Essential for position sizing and stop-loss placement
### 3. Volume Analysis (Up/Down Ratio)
- Analyzes volume distribution over the last 55 periods
- Calculates the ratio of volume on up days vs down days
- Provides insight into buying vs selling pressure
- Values > 1 indicate more buying volume, < 1 indicate more selling volume
### 4. Absolute Relative Strength (ARS)
- **Dual timeframe analysis** with customizable reference points
- **High ARS**: Performance relative to benchmark from a high reference point (default: Sep 27, 2024)
- **Low ARS**: Performance relative to benchmark from a low reference point (default: Apr 7, 2025)
- Uses NSE:NIFTY as default comparison symbol
- Color-coded display: Green for outperformance, Red for underperformance
### 5. Relative Performance Table
- **5 timeframes**: 1 Week, 1 Month, 3 Months, 6 Months, 1 Year
- Shows stock performance **relative to benchmark index**
- Formula: (Stock Return - Index Return) for each period
- **Color coding**:
- Lime: >5% outperformance
- Yellow: -5% to +5% relative performance
- Red: <-5% underperformance
### 6. Dynamic Position Allocation System
- **6-factor scoring system** based on price vs EMAs (21, 55, 189)
- Evaluates:
- Price above/below each EMA
- EMA alignment (21>55, 55>189, 21>189)
- **Allocation recommendations**:
- 100% allocation: Score = 6 (all bullish signals)
- 75% allocation: Score = 4
- 50% allocation: Score = 2
- 25% allocation: Score = 0
- 0% allocation: Score = -2, -4, -6 (bearish signals)
## Display Tables
### Performance Table (Top Right)
Shows relative performance vs benchmark across multiple timeframes with intuitive color coding for quick assessment.
### Metrics Table (Bottom Right)
Displays key statistics:
- **ADR%**: Average Daily Range percentage
- **U/D**: Up/Down volume ratio
- **Allocation%**: Recommended position size
- **High ARS%**: Relative strength from high reference
- **Low ARS%**: Relative strength from low reference
## How to Use This Indicator
### For Trend Analysis
1. **Moving Average Ribbon**: Look for price above ascending MAs for bullish trends
2. **MA Alignment**: Bullish when shorter MAs are above longer MAs
3. **Color coordination**: Use consistent color scheme for quick visual analysis
### For Entry/Exit Timing
1. **Performance Table**: Enter when showing consistent outperformance across timeframes
2. **Volume Analysis**: Confirm entries with U/D ratio > 1.5 for strong buying
3. **ARS Values**: Look for positive ARS readings for relative strength confirmation
### For Position Sizing
1. **Allocation System**: Use the recommended allocation percentage
2. **ADR% Consideration**: Adjust position size based on volatility
3. **Risk Management**: Lower allocation in high ADR% stocks
### For Risk Management
1. **ADR% for Stop Loss**: Set stops at 1-2x ADR% below entry
2. **Relative Performance**: Reduce positions when consistently underperforming
3. **Volume Confirmation**: Be cautious when U/D ratio deteriorates
## Best Practices
### Timeframe Recommendations
- **Intraday**: Use lower MA periods (5, 13, 21, 55)
- **Swing Trading**: Default settings work well (13, 21, 55, 189)
- **Position Trading**: Consider higher periods (21, 50, 100, 200)
### Market Conditions
- **Trending Markets**: Focus on MA alignment and relative performance
- **Sideways Markets**: Rely more on ADR% for range trading
- **Volatile Markets**: Reduce allocation percentage regardless of signals
### Customization Tips
1. Adjust reference dates for ARS calculation based on significant market events
2. Change comparison symbol to sector-specific indices for better relative analysis
3. Modify MA periods based on your trading style and market characteristics
## Technical Specifications
- **Version**: Pine Script v6
- **Overlay**: Yes (plots on price chart)
- **Real-time Updates**: Yes
- **Data Requirements**: Minimum 252 bars for complete calculations
- **Compatible Timeframes**: All standard timeframes
## Limitations
- Performance calculations require sufficient historical data
- ARS calculations depend on selected reference dates
- Volume analysis may be less reliable in low-volume stocks
- Relative performance is only as good as the chosen benchmark
This indicator is designed to provide a comprehensive analysis framework rather than simple buy/sell signals. It's recommended to use this in conjunction with your overall trading strategy and risk management rules.

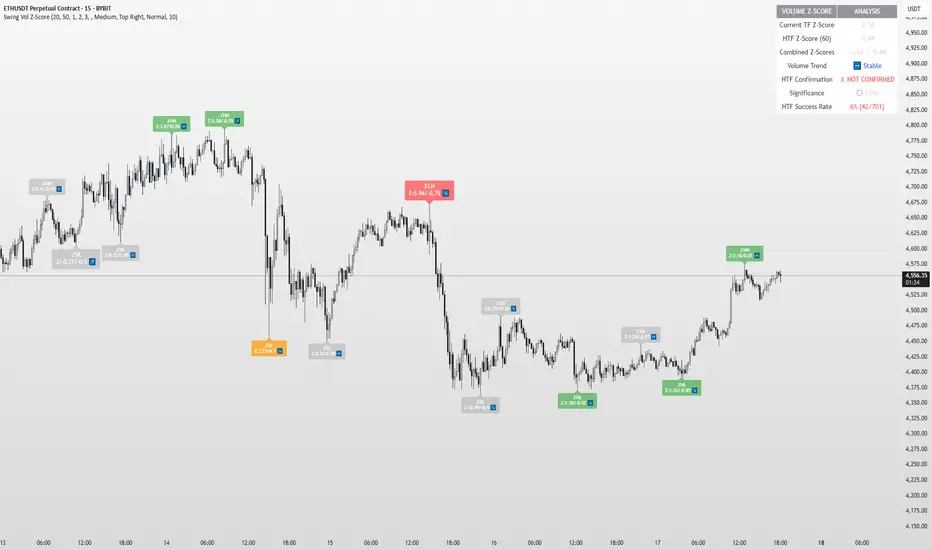
Swing Point Volume Z-ScoreSWING POINT VOLUME Z-SCORE INDICATOR
A volume analysis tool that identifies statistical volume spikes at swing points with optional higher timeframe confirmation.
This indicator uses Leviathan's method of swing detection. All credit to him for his amazing work (and any mistakes mine). I was also inspired by Trading Riot, who's Capitulation indicator gave me the idea to create this one.
WHAT IT DOES
This indicator combines three analytical approaches:
- Volume Z-score calculation to measure volume significance statistically
- Automatic swing point detection (higher highs, lower lows, etc.)
- Optional higher timeframe volume confirmation
The Z-score measures how many standard deviations current volume is from the average, helping identify when volume activity is genuinely elevated rather than relying on visual assessment.
VISUAL SYSTEM
The indicator uses a color-coded approach for quick assessment:
GREEN - Normal Activity (Z-Score 1.0-2.0)
Above-average volume levels
ORANGE - Elevated Activity (Z-Score 2.0-3.0)
High volume activity that may indicate increased interest
RED - Potential Institutional Activity (Z-Score 3.0+)
Very high volume levels that could suggest significant market participation
HIGHER TIMEFRAME CONFIRMATION
When enabled, the indicator checks volume on a higher timeframe:
- Checkmark symbol indicates HTF volume also shows elevation
- X symbol indicates HTF volume doesn't confirm
- Auto-selects appropriate higher timeframe or allows manual selection
KEY FEATURES
Statistical Approach: Uses Z-score methodology rather than arbitrary volume thresholds
Adaptive Thresholds: Can adjust based on market volatility conditions
Swing Focus: Concentrates analysis on structurally important price levels
Volume Trends: Shows whether volume is accelerating or decelerating
Success Tracking: Monitors how often HTF confirmation proves effective
DISPLAY OPTIONS
Basic Mode: Essential features with clean interface
Advanced Mode: Additional customization and analytics
Label Sizing: Four size options to fit different screen setups
Table Position: Moveable info table with transparency control
Custom Colors: Adjustable for different chart themes
PRACTICAL APPLICATIONS
May help identify:
- Volume spikes at support/resistance levels
- Potential accumulation or distribution zones
- Breakout confirmation with volume backing
- Areas where larger market participants might be active
Works on all liquid markets and timeframes, though generally more effective on 15-minute charts and higher.
USAGE NOTES
This is an analytical tool that highlights statistically significant volume events. It should be used as part of a broader analysis approach rather than as a standalone trading system.
The indicator works best when combined with:
- Price action analysis
- Support and resistance identification
- Trend analysis
- Proper risk management
Default settings are designed to work well across most instruments, but users can adjust parameters based on their specific needs and trading style.
TECHNICAL DETAILS
Built with Pine Script v5
Compatible with all TradingView subscription levels
Open source code available for review and learning
Works on stocks, forex, crypto, futures, and other liquid instruments
The statistical approach helps remove some subjectivity from volume analysis, though like all technical indicators, it should be used thoughtfully as part of a complete trading plan.
[Pandora][Swarm] Rapid Exponential Moving AverageENVISIONING POSSIBILITY
What is the theoretical pinnacle of possibility? The current state of algorithmic affairs falls far short of my aspirations for achievable feasibility. I'm lifting the lid off of Pandora's box once again, very publicly this time, as a brute force challenge to conventional 'wisdom'. The unfolding series of time mandates a transcendental systemic alteration...
THE MOVING AVERAGE ZOO:
The realm of digital signal processing for trading is filled with familiar antiquated filtering tools. Two families of filtration, being 'infinite impulse response' (EMA, RMA, etc.) and 'finite impulse response' (WMA, SMA, etc.), are prevalently employed without question. These filter types are the mules and donkeys of data analysis, broadly accepted for use in finance.
At first glance, they appear sufficient for most tasks, offering a basic straightforward way to reduce noise and highlight trends. Yet, beneath their simplistic facade lies a constellation of limitations and impediments, each having its own finicky quirks. Upon closer inspection, identifiable drawbacks render them far from ideal for many real-world applications in today's volatile markets.
KNOWN FUNDAMENTAL FLAWS:
Despite commonplace moving average (MA) popularity, these conventional filters suffer from an assortment of fundamental flaws. Most of them don't genuinely address core challenges of how to preserve the true dynamics of a signal while suppressing noise and retaining cutoff frequency compliance. Their simple cookie cutter structures make them ill-suited in actuality for dynamic market environments. In reality, they often trade one problem for another dilemma, forsaking analytics to choose between distortion and delay.
A deeper seeded issue remains within frequency compliance, how adequately a filter respects (or disrespects) the underlying signal’s spectral properties according to it's assigned periodic parameter. Traditional MAs habitually distort phase relationships, causing delayed reactions with surplus lag or exaggerations with excessive undershoot/overshoot. For applications requiring timely resilience, such as algorithmic trading, these shortcomings are often functionally unacceptable. What’s needed is vigorous filters that can more accurately retain signal behaviors while minimizing lag without sacrificing smoothness and uniformity. Until then, the public MA zoo remains as a collection of corny compromises, rather than a favorable toolbelt of solutions.
P.S.: In PSv7+, in my opinion, many of these geriatric MAs deserve no future with ease of access for the naive, simply not knowing these filters are most likely creating bigger problems than solving any.
R.E.M.A.
What is this? I prefer to think of it as the "radical EMA", definitely along my lines of a retire everything morte algorithm. This isn't your run of the mill average from the petting zoo. I would categorize it as a paradigm shifting rampant economic masochistic annihilator, sufficiently good enough to begin ruthlessly executing moving averages left and right. Um, yeah... that kind of moving average destructor as you may soon recognize with a few 'Filters+' settings adjustments, realizing ordinary EMA has been doing us an injustice all this time.
Does it possess the capability to relentlessly exterminate most averaging filters in existence? Well, it's about time we find out, by uncaging it on the loose into the greater economic wilderness. Only then can we truly find out if it is indeed a radical exponential market accelerant whose time has come. If it is, then it may eventually become a reality erasing monolithic anomaly destined for greatness, ultimately changing the entire landscape of trading in perpetuity.
UNLEASHING NEXT-GEN:
This lone next generation exoweapon algorithm is intended to initiate the transformative beginning stages of mass filtration deprecation. However, it won't be the only one, just the first arrival of it's alien kind from me. Welcome to notion #1 of my future filtration frontier, on this episode of the algorithmic twilight zone. Where reality takes a twisting turn one dimension beyond practical logic, after persistent models of mindset disintegrate into insignificance, followed by illusory perception confronted into cognitive dissonance.
An evolutionary path to genuine advancement resides outside the prison of preconceptions, manifesting only after divergence from persistent binding restrictions of dogmatic doctrines. Such a genesis in transformative thinking will catalyze unbounded cognitive potential, plowing the way for the cultivation of total redesigns of thought. Futuristic innovative breakthroughs demand the surrender of legacy and outmoded understandings.
Now that the world's largest assembly of investors has been ensembled, there are additional tasks left to perform. I'm compelled to deploy this mathematical-weapon of mass financial creation into it's rightful destined hands, to "WE THE PEOPLE" of TV.
SCRIPT INTENTION:
Deprecate anything and everything as any non-commercial member sees desirably fit. This includes your existing code formulations already in working functional modes of operation AND/OR future projects in the works. Swapping is nearly as simple as copying and pasting with meager modifications, after you have identified comparable likeness in this indicators settings with a visual assessment. Results may become eye opening, but only if you dare to look and test.
Where you may suspect a ta.filter() is lacking sufficient luster or may be flat out majorly deficient, employing rema, drema, trema, or qrema configurations may be a more suitable replacement. That's up to you to discern. My code satire already identifies likely bottom of the barrel suspects that either belong in the extinction record or have already been marked for deprecation. They are ordered more towards the bottom by rank where they belong. SuperSmoother is a masterpiece here to stay, being my original go-to reference filter. Everything you see here is already deprecated, including REMA...
REMA CHARACTERISTICS
- VERY low lag
- No overshoot
- Frequency compliant
- Proper initialization at bar_index==0
- Period parameter accepts poitive floating point numerics (AND integers!)
- Infinite impulse response (IIR) filter
- Compact code footprint
- Minimized computational overhead

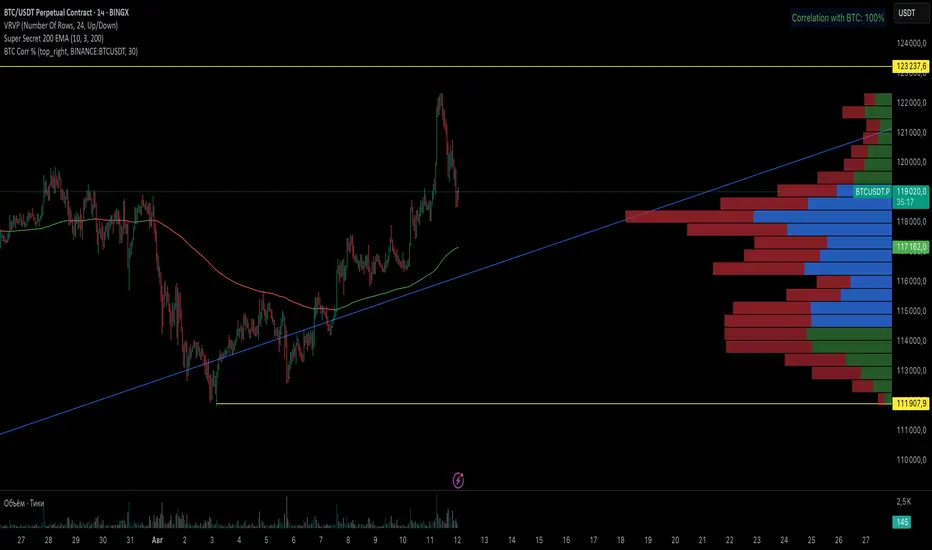
BTC Correlation PercentagePurpose
This indicator displays the correlation percentage between the current trading instrument and Bitcoin (BTC/USDT) as a text label on the chart. It helps traders quickly assess how closely an asset's price movements align with Bitcoin's fluctuations.
Key Features
Precise Calculation: Shows correlation as a percentage with one decimal place (e.g., 25.6%).
Customizable Appearance: Allows adjustment of colors, position, and calculation period.
Clean & Simple: Displays only essential information without cluttering the chart.
Universal Compatibility: Works on any timeframe and with any trading pair.
Input Settings
Core Parameters:
BTC Symbol – Ticker for Bitcoin (default: BINANCE:BTCUSDT).
Correlation Period – Number of bars used for calculation (default: 50 candles).
Show Correlation Label – Toggle visibility of the correlation label.
Visual Customization:
Text Color – Label text color (default: white).
Background Color – Label background color (default: semi-transparent blue).
Border Color – Border color around the label (default: gray).
Label Position – Where the label appears on the chart (default: top-right).
Interpreting Correlation Values
70% to 100% → Strong positive correlation (asset moves in sync with BTC).
30% to 70% → Moderate positive correlation.
-30% to 30% → Weak or no correlation.
-70% to -30% → Moderate negative correlation (asset moves opposite to BTC).
-100% to -70% → Strong negative correlation.
Practical Use Cases
For Altcoins: A correlation above 50% suggests high dependence on Bitcoin’s price action.
For Futures Trading: Helps assess systemic risks tied to BTC movements.
During High Volatility: Determines whether an asset’s price change is driven by its own factors or broader market trends.
How It Works
The indicator recalculates automatically with each new candle. For the most reliable results, it is recommended for use on daily or higher timeframes.
This tool provides traders with a quick, visual way to gauge Bitcoin’s influence on other assets, improving decision-making in crypto markets. 🚀
This response is AI-generated, for reference only.
New chat
TRI - Smart Zones============================================================================
# TRI - SMART ZONES v2.0
## Professional Smart Money Concepts Indicator for Pine Script v6
============================================================================
## 📊 OVERVIEW
**TRI - Smart Zones** is a comprehensive Smart Money Concepts indicator that
combines multiple institutional trading concepts into a single, powerful tool.
Built with Pine Script v6 for optimal performance and reliability.
## 🎯 CORE FEATURES
### **Fair Value Gaps (FVG)**
- **Detection**: Automatic identification of price imbalances
- **Types**: Bullish and Bearish Fair Value Gaps
- **Threshold**: Customizable gap size requirements (0.1% default)
- **Extension**: Configurable zone projection length
- **Mitigation**: Real-time tracking of gap fills
### **Order Blocks (OB)**
- **Detection**: Volume-based institutional footprint identification
- **Types**: Bullish and Bearish Order Blocks
- **Method**: Pivot-based volume analysis with configurable lookback
- **Validation**: Market structure confirmation required
- **Extension**: Adjustable zone projection
### **BSL/SSL Liquidity Levels**
- **Multi-Timeframe**: Automatic higher timeframe reference
- **Dynamic**: Real-time level updates and extensions
- **Visual**: Clear line markings with timeframe labels
- **Smart**: Adaptive timeframe selection based on current chart
### **Fibonacci Extensions**
- **ZigZag Integration**: Advanced pivot point detection
- **Levels**: Customizable Fibonacci ratios (38.2%, 61.8%, 100%, 161.8%)
- **Projection**: Dynamic extension from swing points
- **Visual**: Subtle dashed lines with level/price labels
### **Smart Dashboard**
- **Zone Statistics**: Real-time FVG and OB counts
- **Success Rates**: Mitigation percentages for each zone type
- **Market Bias**: Intelligent bullish/bearish/neutral assessment
- **Positioning**: Customizable location and size
### **Zone Analysis Engine**
- **Technical Confluence**: RSI, ADX, ATR, Volume analysis
- **VWAP Integration**: Institutional price reference
- **Confidence Scoring**: High/Mid/Low signal classification
- **Signal Arrows**: Visual trade direction indicators
## 🔔 ALERT SYSTEM
### **Market Structure Alerts**
- `Market Bias Changed` - Shift in overall market sentiment
- `BSL Touched` - Buy Side Liquidity level reached
- `SSL Touched` - Sell Side Liquidity level reached
### **Zone Touch Alerts**
- `OB Touched` - Any Order Block interaction
- `Bullish OB Touched` - Bullish Order Block touch
- `Bearish OB Touched` - Bearish Order Block touch
- `FVG Touched` - Any Fair Value Gap interaction
- `Bullish FVG Touched` - Bullish FVG touch
- `Bearish FVG Touched` - Bearish FVG touch
- `Zone Touched` - Any Smart Zone interaction
- `Bullish Zone Touched` - Any bullish zone touch
- `Bearish Zone Touched` - Any bearish zone touch
## ⚙️ CONFIGURATION
### **Zone Detection**
- Enable/disable FVG and OB detection independently
- Maximum zones per type (3-15, default: 8)
- Zone-specific threshold and extension settings
### **Visual Customization**
- Individual color schemes for each zone type
- Adjustable transparency levels
- Configurable line styles and widths
- Dashboard positioning and sizing options
### **Technical Analysis**
- RSI, ADX, ATR period customization
- Volume threshold multipliers
- Confidence level color coding
- Signal display toggle
## 🚀 PINE SCRIPT v6 OPTIMIZATIONS
- **User-Defined Types**: Structured data for zones and statistics
- **Methods**: Type-specific operations for better code organization
- **Enhanced Arrays**: Optimized memory management
- **Switch Statements**: Improved performance for zone classification
- **Error Handling**: Robust input validation and edge case management
- **Performance**: Efficient algorithms for real-time analysis
## 📈 TRADING APPLICATIONS
### **Entry Strategies**
- Zone confluence for high-probability setups
- Multi-timeframe confirmation via BSL/SSL
- Fibonacci extension targets
- Signal arrows for directional bias
### **Risk Management**
- Zone mitigation for stop-loss placement
- Market bias for position sizing
- Dashboard statistics for strategy validation
### **Market Analysis**
- Institutional footprint identification
- Liquidity level mapping
- Market structure assessment
- Trend continuation vs reversal analysis
## 🔧 TECHNICAL SPECIFICATIONS
- **Version**: Pine Script v6
- **Overlay**: True (draws on price chart)
- **Max Objects**: 100 boxes, 100 lines, 50 labels
- **Performance**: Optimized for real-time analysis
- **Compatibility**: All TradingView chart types and timeframes


Simple Leveraged PnLThis script shows your live trade PnL, ROE, R:R ratio, margin, leverage, entry, TP, and SL directly on the chart.
It draws:
Green/red zones for your Take Profit and Stop Loss ranges.
A pinned info card (movable to any corner of the chart) showing all key trade details in one place.
You can fully customize:
Card position (top/middle/bottom × left/middle/right)
Text size, colors, and background
Zone transparency
It works for both Long and Short positions and updates in real time.

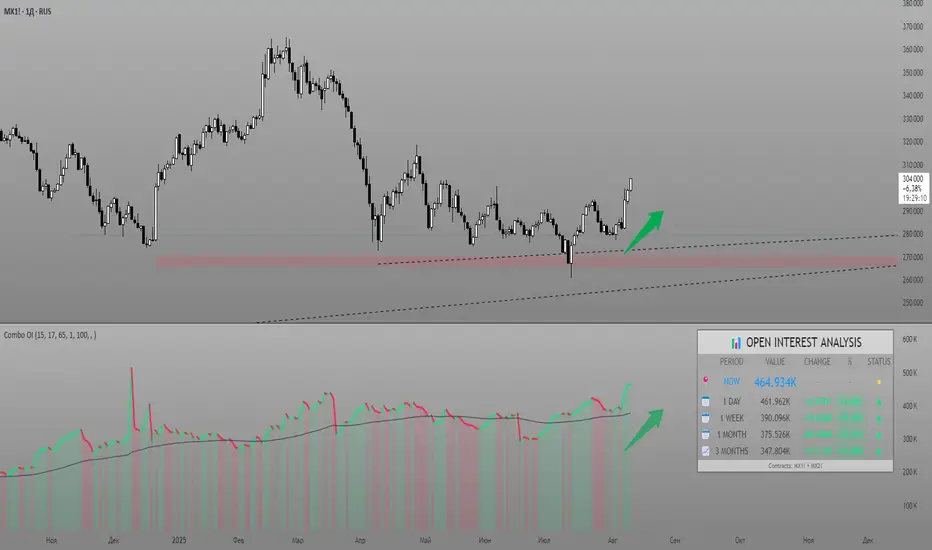
Combined Futures Open Interest [Sam SDF-Solutions]The Combined Futures Open Interest indicator is designed to provide comprehensive analysis of market positioning by aggregating open interest data from the two nearest futures contracts. This dual-contract approach captures the complete picture of market participation, including rollover dynamics between front and back month contracts, offering traders crucial insights into institutional positioning and market sentiment.
Key Features:
Dual-Contract Aggregation: Automatically identifies and combines open interest from the first and second nearest futures contracts (e.g., ES1! + ES2!), providing a complete view of market positioning that single-contract analysis might miss.
Multi-Period Analysis: Tracks open interest changes across multiple timeframes:
1 Day: Immediate market sentiment shifts
1 Week: Short-term positioning trends
1 Month: Medium-term institutional flows
3 Months: Quarterly positioning aligned with contract expiration cycles
Smart Data Handling: Utilizes last known values when data is temporarily unavailable, preventing false signals from data gaps while clearly indicating when stale data is being used.
EMA Smoothing: Incorporates a customizable Exponential Moving Average (default 65 periods) to identify the underlying trend in open interest, filtering out daily noise and highlighting significant deviations.
Dynamic Visualization:
Color-coded main line showing directional changes (green for increases, red for decreases)
Optional fill areas between OI and EMA to visualize momentum
Separate contract lines for detailed rollover analysis
Customizable labels for significant percentage changes
Comprehensive Information Table: Displays real-time statistics including:
Current total open interest across both contracts
Period-over-period changes in absolute and percentage terms
EMA deviation metrics
Visual status indicators for quick assessment
Contract symbols and data quality warnings
Alert System: Configurable alerts for:
Significant daily changes (customizable threshold)
EMA crossovers indicating trend changes
Large percentage movements suggesting institutional activity
How It Works:
Contract Detection: The indicator automatically identifies the base futures symbol and constructs the appropriate contract codes for the two nearest expirations, or accepts manual symbol input for non-standard contracts.
Data Aggregation: Open interest data from both contracts is retrieved and summed, providing a complete picture that accounts for positions rolling between contracts.
Historical Comparison: The indicator calculates changes from multiple lookback periods (1/5/22/66 days) to show how positioning has evolved across different time horizons.
Trend Analysis: The EMA overlay helps identify whether current open interest is above or below its smoothed average, indicating momentum in position building or reduction.
Visual Feedback: The main line changes color based on daily changes, while the optional table provides detailed numerical analysis for traders requiring precise data.
___________________
This indicator is essential for futures traders, particularly those focused on index futures, commodities, or currency futures where understanding the aggregate positioning across nearby contracts is crucial. It's especially valuable during rollover periods when positions shift between contracts, and for identifying institutional accumulation or distribution patterns that single-contract analysis might miss. By combining multiple timeframe analysis with intelligent data handling and clear visualization, it simplifies the complex task of monitoring open interest dynamics across the futures curve.
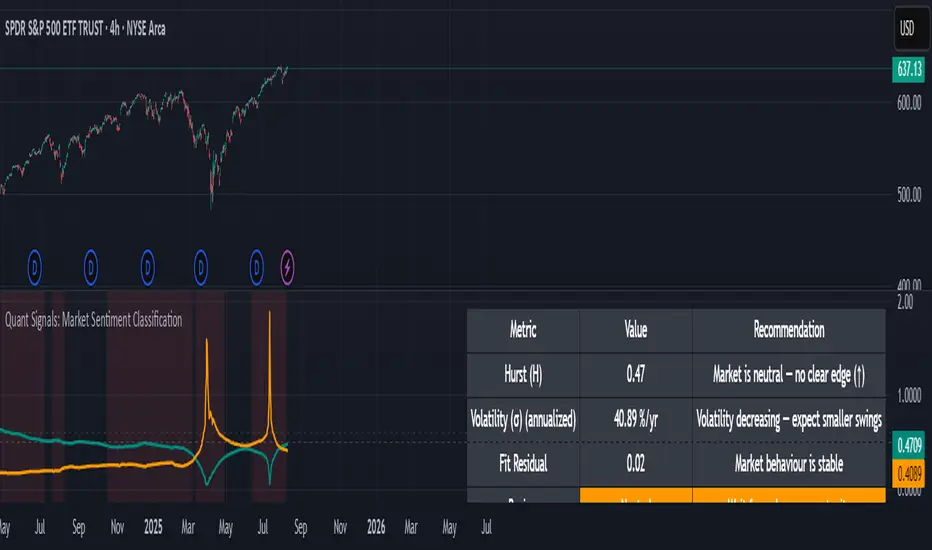
Quant Signals: Market Sentiment Monitor HUDWavelets & Scale Spectrum
This indicator is ideal for traders who adapt their strategy to market conditions — such as swing traders, intraday traders, and system developers.
Trend-followers can use it to confirm trending conditions before entering.
Mean-reversion traders can spot choppy markets where reversals are more likely.
Risk managers can monitor volatility shifts and regime changes to adjust position size or pause trading.
It works best as a market context filter — telling you the “weather” before you decide on the trade.
Wavelets are like tiny “measuring rulers” for price changes. Instead of looking at the whole chart at once, a wavelet looks at differences in price over a specific time scale — for example, 2 bars, 4 bars, 8 bars, and so on.
The scale spectrum is what you get when you measure volatility at several of these scales and then plot them against scale size.
If the spectrum forms a straight line on a log–log chart, it means price changes follow a consistent pattern across time scales (a power-law relationship).
The slope of that line gives the Hurst exponent (H) — telling you whether moves tend to persist (trend) or reverse (mean-revert).
The height of the line gives you the volatility (σ) — the average size of moves.
This approach works like a microscope, revealing whether the market’s behaviour is consistent across short-term and long-term horizons, and when that behaviour changes.
This tool applies a wavelet-based scale-spectrum analysis to price data to estimate three key market state measures inside a rolling window:
Hurst exponent (H) — measures persistence in price moves:
H > ~0.55 → market is trending (moves tend to continue).
H < ~0.45 → market is choppy/mean-reverting (moves tend to reverse).
Values near 0.5 indicate a neutral, random-walk-like regime.
Volatility (σ) — the average size of price swings at your chart’s timeframe, optionally annualized. Rising volatility means larger price moves, falling volatility means smaller moves.
Fit residual — how well the observed multi-scale volatility fits a clean power-law line. Low residual = stable behaviour; high residual = structural change (possible regime shift).
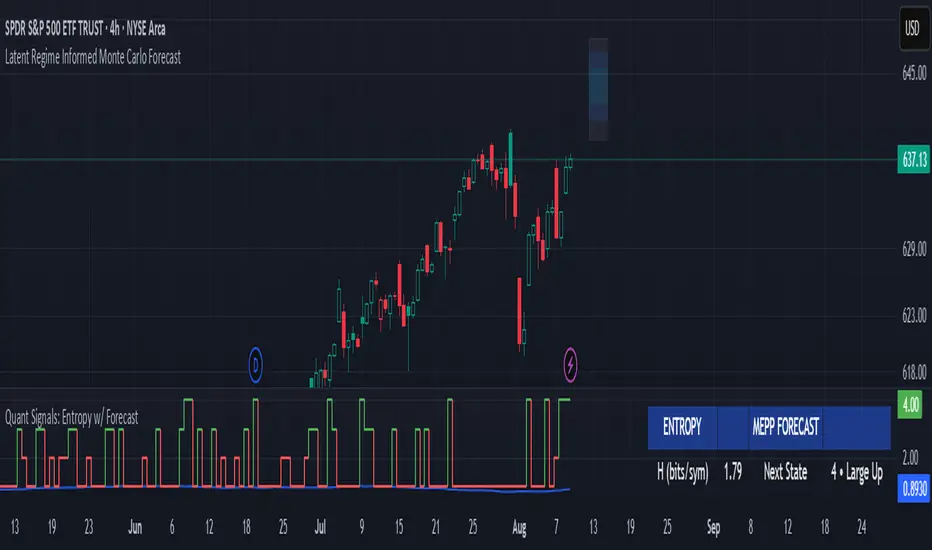
Quant Signals: Entropy w/ ForecastThis is the first of many quantitative signals I plan to create for TV users.
Most technical analysis (TA) tools—like moving averages, oscillators, or chart patterns—are heuristic: they’re based on visually identifiable shapes, threshold crossovers, or empirically chosen rules. These methods rarely quantify the information content or structural complexity of market data. By quantifying market predictability before making a forecast, this method filters out noise and focuses your trading only during statistically favorable conditions—something traditional TA cannot objectively measure.
This MEPP-based approach is quantitative and model-free:
It comes from information theory and measures Shannon entropy rate to assess how predictable the market is at any moment.
Instead of interpreting price formations, it uses a data-compression algorithm (Lempel–Ziv) to capture hidden structure in the sequence of returns.
Forecasts are generated using a principle from statistical physics (Maximum Entropy Production), not historical chart patterns.
In short, this method measures the market's predictability BEFORE deciding a directional forecast is worth trusting. This tool is to inform TA traders on the market's current regime, whether it is smooth and predictable or it is volatile and turbulent.
Technical Introduction:
In information theory, Shannon entropy measures the uncertainty (or information content) in a sequence of data. For markets, the entropy rate captures how much new information price returns generate over time:
Low entropy rate → price changes are more structured and predictable.
High entropy rate → price changes are more random and unpredictable.
By discretizing recent returns into quartile-based states, this indicator:
Calculates the normalized entropy rate as a regime filter.
Uses MEPP to forecast the next state that maximizes entropy production.
Displays both the regime status (predictable vs chaotic) and the forecast bias (bullish/bearish) in a dashboard.
Measurements & How to Use Them
TLDR: HIGH ENTROPY -> information generation/market shift -> Don't trust forecast/strategy
1. H (bits/sym)
Shannon entropy rate of the last μ discrete returns, in bits per symbol (0–2).
Lower → more predictable; higher → more random.
Use as a raw measure of market structure.
2. H_max (log₂Ω)
Theoretical maximum entropy for Ω states. Here Ω = 4 → H_max = 2.0 bits.
Reference value for normalization.
3. Entropy (norm)
H / H_max, scaled between 0 and 1.
< 0.5–0.6 → predictable regime; > 0.6 → chaotic regime.
Main regime filter — forecasts are more reliable when below your threshold.
4. Regime
Label based on Entropy (norm) vs your entThresh.
LOW (predictable) = higher odds forecast will be correct.
HIGH (chaotic) = forecasts less reliable.
5. Next State (MEPP Forecast)
Discrete return state (1–4) predicted to occur next, chosen to maximize entropy production:
Large Down (strong bearish)
Small Down (mild bearish)
Small Up (mild bullish)
Large Up (strong bullish)
Use as your bias direction.
6. Bias
Simplified label from the Next State:
States 1–2 = Bearish bias (red)
States 3–4 = Bullish bias (green)
Align strategy direction with bias only in LOW regime.
Relative Volume + Z-score + Normal Volume + Avg. VolumeA statistical way to visualize volume analytically compared to traditional volume. All Lookback Periods and Colors can be changed so user can make it feel personalized
- Relative Volume (RVOL) visualizer with the color of the histogram bar changing to represent exceeding a threshold specified by the user
For example --> (1.5 = Orange Bar) & (2 = Red Bar)
- Toggle View between RVOL visualization of volume vs. normal view of volume plot
- Z score lookback for volume across specified lookback per what user wants (dot/symbol above the bar)
- Average Volume Plot

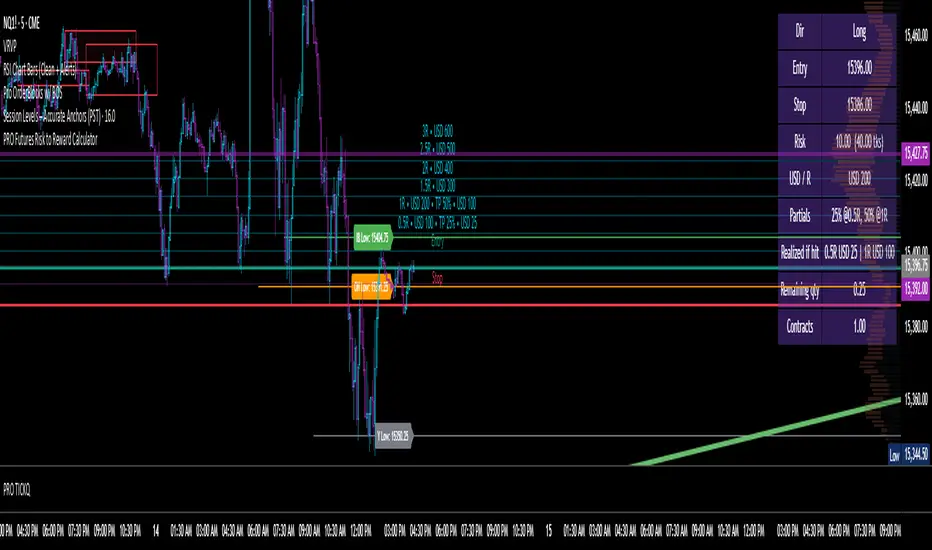
Futures Risk to Reward CalculatorFutures Risk to Reward Calculator with NQ, MNQ, ES, MES, etc price per tick built in.
ADR/ATR Session by LK## **Features**
1. **Custom ADR & ATR Calculation**
* Calculates **Average Daily Range (ADR)** and **Average True Range (ATR)** separately for:
* **Session timeframe** (default H4 / 06:00–13:00)
* **Daily timeframe**
* Independent smoothing method selection (**SMA, EMA, RMA, WMA**) for H4 ADR, H4 ATR, Daily ADR, and Daily ATR.
2. **Percentage Metrics**
* % of ADR / ATR covered by the **current H4 bar**.
* ADR / ATR expressed as a percentage of the **current price**.
* % of ADR already reached for the **current day**.
* % of Daily ATR vs current day’s True Range.
3. **Dynamic Chart Lines**
* Draws **3 lines for H4**: Session Open, ADR High, ADR Low.
* Draws **3 lines for Daily**: Daily Open, ADR High, ADR Low.
* Lines **extend to the right** so they stay visible across the chart.
* Colors and widths are fully customizable.
4. **Real-Time Data Table**
* Compact table displaying all ADR/ATR values and percentages.
* Adjustable table font size (**tiny, small, normal, large, huge**).
* Transparent background option for minimal chart obstruction.
5. **Flexible Session Settings**
* Select session start and end time in hours/minutes.
* Choose session timezone (chart timezone or major financial centers).
* Toggle H4 lines, Daily lines separately.
6. **Lookahead Control**
* Option to wait for higher-timeframe candle close before updating values (more accurate, less repainting).
---
## **How to Use**
### **1. Adding the Indicator**
* Copy and paste the Pine Script into TradingView’s Pine Editor.
* Click **“Add to chart”**.
* Make sure your chart supports the higher timeframes you choose (e.g., H4 and Daily).
### **2. Setting Your Session**
* **Session Start Hour** & **End Hour** → Defines the intraday session to measure ADR/ATR (default: 06:00–13:00).
* **Session Timezone** → Pick “Chart” or a major financial center (e.g., New York, London, Tokyo).
### **3. Choosing Smoothing Methods**
* For each ADR/ATR (H4 and Daily), choose:
* SMA (Simple)
* EMA (Exponential)
* RMA (Wilder’s smoothing)
* WMA (Weighted)
### **4. Adjusting Chart Display**
* **Show H4 Lines** → Displays session open and ADR High/Low for the current H4 session.
* **Show Daily Lines** → Displays daily open and ADR High/Low.
* Customize line colors and widths.
### **5. Reading the Table**
* **H4 Section**
* ADR / ATR values for the selected session.
* % of ADR/ATR covered by the **current H4 bar**.
* ADR/ATR as % of the current price.
* **Daily Section**
* ADR / ATR for the daily timeframe.
* % of ADR already covered by today’s range.
* ADR/ATR as % of price.
### **6. Pro Tips**
* Use **H4 ADR %** to gauge intraday exhaustion — if current range is near 100%, market may slow or reverse.
* Use **Daily ADR %** for swing trade context — if a day has moved beyond its ADR, expect lower continuation probability.
* Combine with support/resistance to identify high-probability reversal zones.

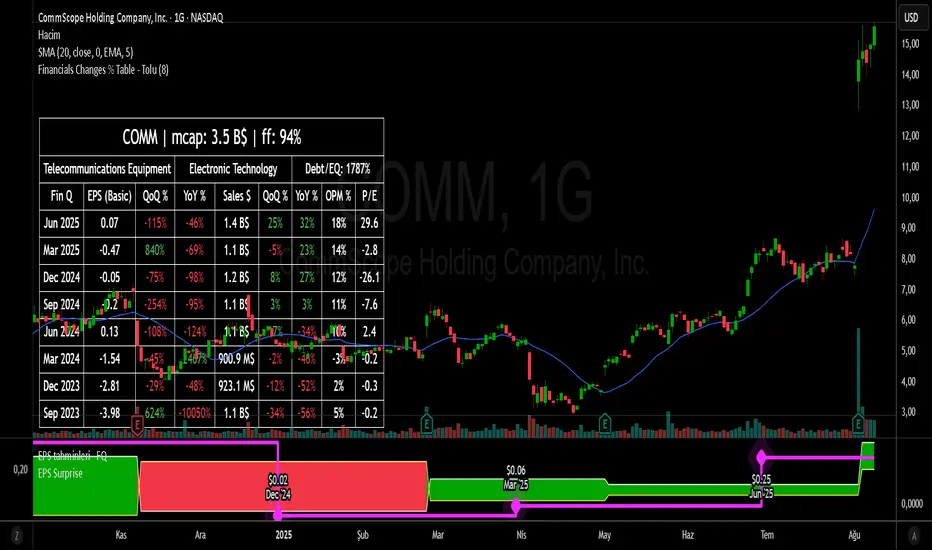
Financial Change % Table - ToluFinancial Change % Table which includes revenue , operating profit and earning per share . compares the financial data with previous quarter QoQ and previous year YoY . and shows the change in %.
Cycle Phase & ETA Tracker [Robust v4]
Cycle Phase & ETA Tracker
Description
The Cycle Phase & ETA Tracker is a powerful tool for analyzing market cycles and predicting the completion of the current cycle (Estimated Time of Arrival, or ETA). It visualizes the cycle phase (0–100%) using a smoothed signal and displays the forecasted completion date with an optional confidence band based on cycle length variability. Ideal for traders looking to time their trades based on cyclical patterns, this indicator offers flexible settings for robust cycle analysis.
Key Features
Cycle Phase Visualization: Tracks the current cycle phase (0–100%) with color-coded zones: green (0–33%), blue (33–66%), orange (66–100%).
ETA Forecast: Shows a vertical line and label indicating the estimated date of cycle completion.
Confidence Band (±σ): Displays a band around the ETA to reflect uncertainty, calculated using the standard deviation of cycle lengths.
Multiple Averaging Methods: Choose from three methods to calculate average cycle length:
Median (Robust): Uses the median for resilience against outliers.
Weighted Mean: Prioritizes recent cycles with linear or quadratic weights.
Simple Mean: Applies equal weights to all cycles.
Adaptive Cycle Length: Automatically adjusts cycle length based on the timeframe or allows a fixed length.
Debug Histogram: Optionally displays the smoothed signal for diagnostic purposes.
Setup and Usage
Add the Indicator:
Search for "Cycle Phase & ETA Tracker " in TradingView’s indicator library and apply it to your chart.
Configure Parameters:
Core Settings:
Track Last N Cycles: Sets the number of recent cycles used to calculate the average cycle length (default: 20). Higher values provide stability but may lag market shifts.
Source: Selects the data source for analysis (e.g., close, open, high; default: close price).
Use Adaptive Cycle Length?: Enables automatic cycle length adjustment based on timeframe (e.g., shorter for intraday, longer for daily) or uses a fixed length if disabled.
Fixed Cycle Length: Defines the cycle length in bars when adaptive mode is off (default: 14). Smaller values increase sensitivity to short-term cycles.
Show Debug Histogram: Enables a histogram of the smoothed signal for debugging signal behavior.
Cycle Length Estimation:
Average Mode: Selects the method for calculating average cycle length: "Median (Robust)", "Weighted Mean", or "Simple Mean".
Weights (for Weighted Mean): For "Weighted Mean", chooses "linear" (moderate emphasis on recent cycles) or "quadratic" (strong emphasis on recent cycles).
ETA Visualization:
Show ETA Line & Label: Toggles the display of the ETA line and date label.
Show ETA Confidence Band (±σ): Toggles the confidence band around the ETA, showing the uncertainty range.
Band Transparency: Adjusts the transparency of the confidence band (0 = fully transparent, 100 = fully opaque; default: 85).
ETA Color: Sets the color for the ETA line, label, and confidence band (default: orange).
Interpretation:
The cycle phase (0–100%) indicates progress: green for the start, blue for the middle, and orange for the end of the cycle.
The ETA line and label show the predicted cycle completion date.
The confidence band reflects the uncertainty range (±1 standard deviation) of the ETA.
If a warning "Insufficient cycles for ETA" appears, wait for the indicator to collect at least 3 cycles.
Limitations
Requires at least 3 cycles for reliable ETA and confidence band calculations.
On low timeframes or low-volatility markets, zero-crossings may be infrequent, delaying ETA updates.
Accuracy depends on proper cycle length settings (adaptive or fixed).
Notes
Test the indicator across different assets and timeframes to optimize settings.
Use the debug histogram to troubleshoot if the ETA appears inaccurate.
For feedback or suggestions, contact the author via TradingView.
Cycle Phase & ETA Tracker
Описание
Индикатор Cycle Phase & ETA Tracker предназначен для анализа рыночных циклов и прогнозирования времени завершения текущего цикла (ETA — Estimated Time of Arrival). Он отслеживает фазы цикла (0–100%) на основе сглаженного сигнала и отображает предполагаемую дату завершения цикла с опциональной доверительной полосой, основанной на стандартном отклонении длин циклов. Индикатор идеально подходит для трейдеров, которые хотят выявлять циклические закономерности и планировать свои действия на основе прогнозируемого времени.
Ключевые особенности
Фазы цикла: Визуализирует текущую фазу цикла (0–100%) с цветовой кодировкой: зеленый (0–33%), синий (33–66%), оранжевый (66–100%).
Прогноз ETA: Показывает вертикальную линию и метку с предполагаемой датой завершения цикла.
Доверительная полоса (±σ): Отображает зону неопределенности вокруг ETA, основанную на стандартном отклонении длин циклов.
Гибкие методы усреднения: Поддерживает три метода расчета средней длины цикла:
Median (Robust): Медиана, устойчивая к выбросам.
Weighted Mean: Взвешенное среднее, где недавние циклы имеют больший вес (линейный или квадратичный).
Simple Mean: Простое среднее с равными весами.
Адаптивная длина цикла: Автоматически подстраивает длину цикла под таймфрейм или позволяет задать фиксированную длину.
Отладочная гистограмма: Опционально отображает сглаженный сигнал для анализа.
Настройка и использование
Добавьте индикатор:
Найдите "Cycle Phase & ETA Tracker " в библиотеке индикаторов TradingView и добавьте его на график.
Настройте параметры:
Core Settings:
Track Last N Cycles: Количество последних циклов для расчета средней длины (по умолчанию 20). Большие значения дают более стабильные результаты, но могут запаздывать.
Source: Источник данных (по умолчанию цена закрытия).
Use Adaptive Cycle Length?: Включите для автоматической настройки длины цикла по таймфрейму или отключите для использования фиксированной длины.
Fixed Cycle Length: Длина цикла в барах, если адаптивная длина отключена (по умолчанию 14).
Show Debug Histogram: Включите для отображения сглаженного сигнала (полезно для отладки).
Cycle Length Estimation:
Average Mode: Выберите метод усреднения: "Median (Robust)", "Weighted Mean" или "Simple Mean".
Weights (for Weighted Mean): Для режима "Weighted Mean" выберите "linear" (умеренный вес для новых циклов) или "quadratic" (сильный вес для новых циклов).
ETA Visualization:
Show ETA Line & Label: Включите для отображения линии и метки ETA.
Show ETA Confidence Band (±σ): Включите для отображения доверительной полосы.
Band Transparency: Прозрачность полосы (0 — полностью прозрачная, 100 — полностью непрозрачная, по умолчанию 85).
ETA Color: Цвет для линии, метки и полосы (по умолчанию оранжевый).
Интерпретация:
Фаза цикла (0–100%) показывает прогресс текущего цикла: зеленый — начало, синий — середина, оранжевый — конец.
Линия и метка ETA указывают предполагаемую дату завершения цикла.
Доверительная полоса показывает диапазон неопределенности (±1 стандартное отклонение).
Если отображается предупреждение "Insufficient cycles for ETA", дождитесь, пока индикатор соберет минимум 3 цикла.
Ограничения
Требуется минимум 3 цикла для надежного расчета ETA и доверительной полосы.
На низких таймфреймах или рынках с низкой волатильностью пересечения нуля могут быть редкими, что замедляет обновление ETA.
Эффективность зависит от правильной настройки длины цикла (fixedL или адаптивной).
Примечания
Протестируйте индикатор на разных таймфреймах и активах, чтобы подобрать оптимальные параметры.
Используйте отладочную гистограмму для анализа сигнала, если ETA кажется неточным.
Для вопросов или предложений по улучшению свяжитесь через TradingView.

Entropy (Fiedor/Kontoyiannis) - Part 2 of Fiedor's TheoryThis indicator estimates the Shannon entropy of a price series using a Markov chain model of binary returns, following the approach of Fiedor (2014) and Kontoyiannis (1997).
% of Max shows current entropy as a percentage of its theoretical maximum (1 bit for binary up/down moves).
Percentile ranks the current entropy against historical values in the chosen lookback window.
High entropy suggests price movement is less predictable by frequentist models; low entropy implies more structure and predictability.
Use this as an informational oscillator, not a trading signal.
This is a visualization of Part 1 of Fiedor's Theory. The same entropy logic is already embedded in Part 1 however the second pane is a nice reminder of why it works.

Binance Funding Rates [vichtoreb]Source: www.binance.com
The funding rate has two components: the interest rate and the average Premium Index.
Binance furnishes the Premium Index data for crypto assets on the TradingView platform. This script uses that data to calculate the funding rate.
Binance updates the Premium Index every 5 seconds.
The average Premium Index (denoted **P\_avg**) is the time-weighted average of all Premium Index data points:
P_avg = wma(Premium Index, n)
where **n** is the averaging length.
At each change time—8:00 PM, 4:00 AM, and 12:00 PM (UTC-4)—Binance sets
P_avg = wma(Premium Index, 5 760)
This is the weighted moving average of the last 8 hours because 5 760 × 5 s = 8 h. Binance then calculates the new funding rate:
Funding Rate = P_avg + clamp(interest rate − P_avg, −0.05 %, 0.05 %)
This value updates only at those change times (8:00 PM, 4:00 AM, and 12:00 PM, UTC-4).
**Indicator precision**
TradingView limits historical requests to 5 000 candles. To match Binance exactly, 5 760 candles are required. As a workaround, the script samples the Premium Index every *resolution* seconds (or minutes), where *resolution* is the indicator’s timeframe input.
If it weren't for this limitation, setting resolution = 5 sec, we would get EXACTLY the same result as the official one
**Interest rate**
On Binance Futures, the interest rate is 0.03 % per day by default (0.01 % per funding interval, as funding occurs every 8 hours). This does not apply to certain contracts, such as ETH/BTC, for which the interest rate is 0 %.
**Estimate line**
If the “show estimate” input is enabled, the indicator plots
wma(Premium Index, n) + clamp(interest rate − P_avg, −0.05 %, 0.05 %)
with **n** equal to the number of bars that have elapsed since the last funding-rate change.
