Time Cycles [TMU]Title: Time Cycles
Description:
This indicator is a comprehensive Time-Based Market Structure tool designed to segment the trading day into fixed temporal windows using New York Time logic. Unlike standard price-lagging indicators (like MA or RSI), this script focuses purely on Time and Price geometry, visualizing how price action behaves within specific 90-minute, 30-minute, and 10-minute intervals.
It is engineered to help traders visualize the "Time" component of the chart by projecting historical high/low ranges and key opening prices automatically using advanced array management.
Underlying Logic & Calculation
The script operates on a fixed time schedule (defaulting to America/New_York timezone) to generate three distinct layers of analysis:
1. The "Previous 90-Minute Cycle" Engine The script identifies fixed 90-minute blocks starting from 02:30 NY time.
Logic: At the close of each 90-minute window, the script records the Highest High and Lowest Low of that specific session .
Projection (PCH/PCL): These levels are projected forward into the next 90-minute window as static support/resistance zones (PCH - Previous Cycle High, PCL - Previous Cycle Low) using a "Step-Locked" mechanism that prevents repainting of the projected level.
Equilibrium (EQ): The script automatically calculates the 50% mean level between the PCH and PCL to highlight the premium/discount midpoint of the previous range.
2. Intraday Cycle Phases The indicator visualizes the fractal nature of time by highlighting specific 30-minute and 90-minute sessions.
Phases: The script categorizes sessions into three customizable structural phases: Accumulation (Blue), Manipulation (Red), and Distribution (Green). This helps traders identify the potential intent of price action within a specific time window.
Visualization: It draws background ranges based on hard-coded timestamps (e.g., 02:30–04:00 for the first London cycle) to visually segregate market phases.
3. Key Opening Price Anchors The script plots significant "Time Opens" that act as institutional reference points.
Midnight Open (00:00 NY): The exact opening price of the day.
09:30 Open: The standard US Equity Market Open price.
Weekly/Yearly Opens: Uses non-repainting request.security calls to fetch higher-timeframe open prices.
Cycle Open (C.O.): The opening price of the current 90-minute macro bucket.
Unique Features & Originality
This script implements custom algorithmic solutions to manage time-based data, distinguishing it from standard library indicators:
Custom 10-Minute Box Arrays: Unlike standard security calls, this script uses a box array system to capture and render 10-minute micro-structures (tenBoxes) directly on the chart. It calculates the High/Low of every 10-minute block dynamically and stores them in a rolling array to visualize sub-fractal structure without changing timeframes.
Object-Oriented Line Management: To optimize performance and maintain a clean chart, the script employs a custom User-Defined Type (type Lines). This allows for an advanced "garbage collection" method (manage_lines) that automatically trims, extends, or deletes opening lines based on the current time, ensuring that historical data does not clutter the workspace.
Predictive "Step-Locked" Projection: The code utilizes a logic state that locks the previous cycle's coordinates (prevCycHigh, prevCycLow) only upon the confirmed close of the session, projecting these specific coordinates forward using box.new rather than plot, allowing for precise, interactive visual blocks.
How to Use
PCH/PCL Boxes: Use the projected boxes from the previous 90m cycle as potential Support (PCL) or Resistance (PCH) for the current cycle.
EQ Line: The orange line represents the "Fair Value" of the previous range.
Settings: Users can toggle visibility for 30m cycles, 10m boxes, and opening lines independently to suit their strategy.
Disclaimer: This tool is for structural analysis and visualization of time windows. It does not guarantee future price movement. Past performance is not indicative of future results.
Timeframes

Jerry's TrueDay Opening Ranges & H/L'sClick around. True Day H12 opening on Weekly and above, and H1 Attempted Direction Range on Daily.

PyraTime Intraday Cycles**Concept and Methodology**
PyraTime Intraday Cycles is a technical analysis tool designed to introduce the concept of **Temporal Cycle Projection**. While most indicators analyze price action (Y-axis), this tool focuses exclusively on the X-axis (Time).
By anchoring to a specific "Origin Pivot" (a user-defined High or Low), the script projects harmonic time intervals into the future. These vertical vectors serve as a grid, helping traders identify moments where time-based cycles may align with price structure.
**Technical Features**
This edition is optimized for **Multi-Timeframe Harmonic Flows**, utilizing a fixed algorithm for key intervals:
* **Anchor Point Logic:** The user manually selects a significant market pivot. The script calculates forward projections from this exact timestamp.
* **Standard Rhythms:** This version renders the **5-minute**, **15-minute**, **1-hour**, and **Daily** harmonic sequences. This allows for analysis across scalping, intraday, and swing trading structures.
* **Visual Confluence:** The indicator draws vertical lines to highlight potential zones of temporal exhaustion or acceleration.
**How to Use**
1. **Identify a Pivot:** Locate a significant High or Low on the chart.
2. **Set the Origin:** Open the settings and input the date/time of that pivot.
3. **Analyze Confluence:** Watch how price behaves when it approaches a vertical line. If price hits a key support/resistance level *at the same time* it hits a PyraTime vertical line, this is considered a high-probability "Time/Price" intersection.
**Version Comparison**
This script represents the foundational layer of the Great Pyramid system (PyraTime Apex).
* **PyraTime Intraday Cycles (This Script):** Focuses on Standard Timeframes (5m, 15m, 1h, Daily).
* **GPM Architecture (Advanced):** The full methodology extends these calculations to Esoteric Sequences (33, 144, 108), includes 3x Cycle Extensions, and features a Predictive Dashboard for complex multi-timeframe analysis.
**Disclaimer**
This tool is for educational and analytical purposes only. It identifies time cycles, not price direction. Past performance of a time cycle does not guarantee future results.

RCV Essentials════════════════════════════════════════════
RCV ESSENTIALS - MULTI-TIMEFRAME & SESSION ANALYSIS TOOL
════════════════════════════════════════════
📊 WHAT THIS INDICATOR DOES
This professional-grade indicator combines two powerful analysis modules:
1. TRADING SESSION TRACKER - Visualizes high/low ranges for major global market sessions (NY Open, London Open, Asian Session, etc.)
2. MULTI-TIMEFRAME CANDLE DISPLAY - Shows up to 8 higher timeframes simultaneously on your chart (15m, 30m, 1H, 4H, 1D, 1W, 1M, 3M)
════════════════════════════════════════════
🎯 KEY FEATURES
════════════════════════════════════════════
TRADING SESSIONS MODULE:
✓ Track up to 6 custom trading sessions simultaneously
✓ Real-time high/low range detection during active sessions
✓ Pre-configured for NYO (7-9am), LNO (2-3am), Asian Session (4:30pm-12am)
✓ 60+ global timezone options
✓ Customizable colors, labels, and transparency
✓ Daily divider lines (optional Sunday skip for traditional markets)
✓ Only displays on ≤30m timeframes for optimal clarity
MULTI-TIMEFRAME CANDLES MODULE:
✓ Display 1-8 higher timeframes with up to 10 candles each
✓ Real-time candle updates (non-repainting)
✓ Fully customizable colors (separate bullish/bearish for body/border/wick)
✓ Adjustable candle width, spacing, and positioning
✓ Smart label system (top/bottom/both, aligned or follow candles)
✓ Automatic timeframe validation (only shows TFs higher than chart)
✓ Memory-optimized with automatic cleanup
════════════════════════════════════════════
🔧 HOW IT WORKS
════════════════════════════════════════════
TECHNICAL IMPLEMENTATION:
Session Tracking Algorithm:
• Detects session start/end using time() function with timezone support
• Continuously monitors and updates high/low during active session
• Finalizes range when session ends using var persistence
• Draws boxes using real-time bar_index positioning
• Maintains session ranges across multiple days for reference
Multi-Timeframe System:
• Uses ta.change(time()) detection to identify new MTF candle formation
• Constructs candles using custom Type definitions (Candle, CandleSet, Config)
• Stores OHLC data in arrays with automatic size management
• Renders using box objects (bodies) and line objects (wicks)
• Updates current candle every tick; historical candles remain static
• Calculates dynamic positioning based on user settings (offset, spacing, width)
Object-Oriented Architecture:
• Custom Type "Candle" - Stores OHLC values, timestamps, visual elements
• Custom Type "CandleSet" - Manages arrays of candles + settings per timeframe
• Custom Type "Config" - Centralizes all display configuration
• Efficient memory management via unshift() for new candles, pop() for old
Performance Optimizations:
• var declarations minimize recalculation overhead
• Conditional execution (sessions only on short timeframes)
• Maximum display limits prevent excessive object creation
• Timeframe validation at barstate.isfirst reduces redundant checks
════════════════════════════════════════════
📈 HOW TO USE
════════════════════════════════════════════
SETUP:
1. Add indicator to chart (works best on 1m-30m timeframes)
2. Open Settings → "Trading Sessions" group
- Enable desired sessions (NYO, LNO, AS, or custom)
- Select your timezone from 60+ options
- Adjust colors and transparency
3. Open Settings → "Multi-TF Candles" group
- Enable timeframes (TF1-TF8)
- Configure each timeframe and display count
- Customize colors and layout
READING THE CHART:
• Session boxes show high/low ranges during active sessions
• MTF candles display to the right of current price
• Labels identify each timeframe (15m, 1H, 4H, etc.)
• Real-time updates on the most recent MTF candle
TRADING APPLICATIONS:
Session Breakout Strategy:
→ Identify session high/low (e.g., Asian session 16:30-00:00)
→ Wait for break above/below range
→ Confirm with higher timeframe candle close
→ Enter in breakout direction, stop at opposite side of range
Multi-Timeframe Confirmation:
→ Spot setup on primary chart (e.g., 5m)
→ Verify 15m, 1H, 4H candles align with trade direction
→ Only take trades where higher TFs confirm
→ Exit when higher TF candles show reversal
Combined Session + MTF:
→ Asian session establishes range overnight
→ London Open breaks Asian high
→ Confirm with bullish 15m + 1H candles
→ Enter long with stop below Asian high
════════════════════════════════════════════
🎨 ORIGINALITY & INNOVATION
════════════════════════════════════════════
What makes this indicator original:
1. INTEGRATED DUAL-MODULE DESIGN
Unlike separate session or MTF indicators, this combines both in a single performance-optimized script, enabling powerful correlation analysis between session behavior and timeframe structure.
2. ADVANCED RENDERING SYSTEM
Uses custom Pine Script v5 Types with dynamic box/line object management instead of basic plot functions. This enables:
• Precise visual control over positioning and spacing
• Real-time updates without repainting
• Efficient memory handling via automatic cleanup
• Support for 8 simultaneous timeframes with independent settings
3. INTELLIGENT SESSION TRACKING
The algorithm continuously recalculates ranges bar-by-bar during active sessions, then preserves the final range. This differs from static zone indicators that simply draw fixed boxes at predefined levels.
4. MODULAR ARCHITECTURE
Custom Type definitions (Candle, CandleSet, Config) create extensible, maintainable code structure while supporting complex multi-timeframe operations with minimal performance impact.
5. PROFESSIONAL FLEXIBILITY
Extensive customization: 6 configurable sessions, 8 timeframe slots, 60+ timezones, granular color/sizing/spacing controls, multiple label positioning modes—adaptable to any market or trading style.
6. SMART VISUAL DESIGN
Automatic timeframe validation, dynamic label alignment options, and intelligent spacing calculations ensure clarity even with multiple timeframes displayed simultaneously.
════════════════════════════════════════════
⚙️ CONFIGURATION OPTIONS
════════════════════════════════════════════
TRADING SESSIONS:
• Session 1-6: On/Off toggles
• Time Ranges: Custom start-end times
• Labels: Custom text for each session
• Colors: Individual color per session
• Timezone: 60+ options (Americas, Europe, Asia, Pacific, Africa)
• Range Transparency: 0-100%
• Outline: Optional border
• Label Display: Show/hide session names
• Daily Divider: Dotted lines at day changes
• Skip Sunday: For traditional markets vs 24/7 crypto
MULTI-TF CANDLES:
• Timeframes 1-8: Enable/disable individually
• Timeframe Selection: Any TF (seconds to months)
• Display Count: 1-10 candles per timeframe
• Bullish Colors: Body/Border/Wick (independent)
• Bearish Colors: Body/Border/Wick (independent)
• Candle Width: 1-10+ bars
• Right Margin: 0-200+ bars from edge
• TF Spacing: Gap between timeframe groups
• Label Color: Any color
• Label Size: Tiny/Small/Normal/Large/Huge
• Label Position: Top/Bottom/Both
• Label Alignment: Follow Candles or Align
════════════════════════════════════════════
📋 TECHNICAL SPECIFICATIONS
════════════════════════════════════════════
• Pine Script Version: v5
• Chart Overlay: True
• Max Boxes: 500
• Max Lines: 500
• Max Labels: 500
• Max Bars Back: 5000
• Update Frequency: Real-time (every tick)
• Timeframe Compatibility: Chart TF must be lower than selected MTFs
• Session Display: Activates only on ≤30 minute timeframes
• Memory Management: Automatic cleanup via array operations

EMA 200 MultiTF G/R + Cross Alerts by LifeHack Trader1. Indicator Setup
The script starts by defining the version of Pine Script (v5) and creating an indicator called "EMA 200 MultiTF G/R + Cross Alerts by LifeHack Trader."
The overlay=true parameter ensures that the indicator is plotted directly on the price chart.
2. Function to Get EMA200
A custom function getEma200 is defined to retrieve the 200-period Exponential Moving Average (EMA) for a specified timeframe (tf).
This function uses the request.security function to fetch the close price's EMA from different timeframes.
3. Calculate EMA200 for Multiple Timeframes
The script calculates the EMA200 for four timeframes: 15 minutes ("15"), 1 hour ("60"), 4 hours ("240"), and 1 day ("D").
These values are stored in variables (ema15, ema1h, ema4h, ema1d) and represent the EMA for each timeframe.
4. Determine Price Above or Below EMA200 (G/R)
For each timeframe, the script checks whether the closing price is above or below the EMA200.
It uses boolean checks to determine if the price is above the EMA200, assigning the status "G" (Green) for above and "R" (Red) for below.
5. Cross Signal Detection (Up/Down)
The script detects crossovers and crossunders between the price and EMA200 for each timeframe.
A crossover signal is detected when the price crosses above the EMA200 (bullish), and a crossunder signal is detected when the price crosses below the EMA200 (bearish).
These signals are stored in separate variables (crossUp, crossDown).
6. Display a Table with G/R Status and Cross Alerts
A table is created and displayed in the top-right corner of the chart. The table shows the status (G or R) for each timeframe and the cross signal (▲ for crossover, ▼ for crossunder, or - for no cross event).
The table is updated with the respective values for each timeframe every time a new bar is formed.
7. Alert Conditions
The script defines alert conditions based on the crossovers and crossunders.
When a price crosses above the EMA200 (cross-up), an alert is triggered for a potential buy opportunity. When the price crosses below the EMA200 (cross-down), an alert is triggered for a potential sell opportunity.
Alerts are configured for each timeframe (15 minutes, 1 hour, 4 hours, and 1 day).
This script provides a comprehensive system for monitoring price action relative to the EMA200 on multiple timeframes, highlighting crossovers, and delivering visual feedback and alerts based on the price's relationship with the EMA.

Trend CandlesTrend Candles
Overview
The Trend Candles indicator is a simple yet effective tool designed to help traders visually identify the prevailing market trend. By combining candle coloring with a trend-based Exponential Moving Average (EMA), it enhances chart readability and makes trend-following strategies easier to apply.
Concepts
Exponential Moving Average (EMA): The EMA is a moving average that places more weight on recent price data. It reacts faster to price changes compared to a Simple Moving Average (SMA), making it well-suited for trend detection.
Trend Determination:
- If the EMA is rising (current EMA > previous EMA), the market is considered bullish.
- If the EMA is falling (current EMA < previous EMA), the market is considered bearish.
- If the EMA is flat (no significant change), no trend color is applied.
Candle Coloring:
- Green candles = Uptrend
- Purple candles = Downtrend
- Default candles = Sideways/Flat EMA
Features
- Trend Visualization: Candles automatically change color based on EMA slope, making it easy to spot bullish and bearish phases.
- Customizable EMA Length: The trader can set the EMA period (default is 50), allowing flexibility for short-term or long-term trend analysis.
- Overlay EMA Line: An orange EMA line is plotted on the chart for additional confirmation of the trend.
- Clean & Minimalist: Focuses on trend clarity without cluttering the chart with unnecessary signals.
How to Use
1. Apply the indicator to your chart.
2. Adjust the EMA Length as per your trading style (shorter = faster signals, longer = smoother trend).
3. Follow the candle color:
- Green = Favor long entries.
- Purple = Favor short entries.
- No color = Stay cautious, as trend is unclear.
4. Use with other confirmation tools (support/resistance, volume, or oscillators).
5. Users are encouraged to experiment with different EMA lengths. The default length is 50, but you can explore other values based on your needs. In particular, try Fibonacci numbers such as 13, 21, 34, 55, 89, 144, and 233 to observe how trends behave differently.
Disclaimer
The information provided by the Trend Candles indicator is for educational purposes only. It should not be considered financial advice. Trading involves substantial risk, and past performance is not necessarily indicative of future results. Always do your own research and use risk management practices.

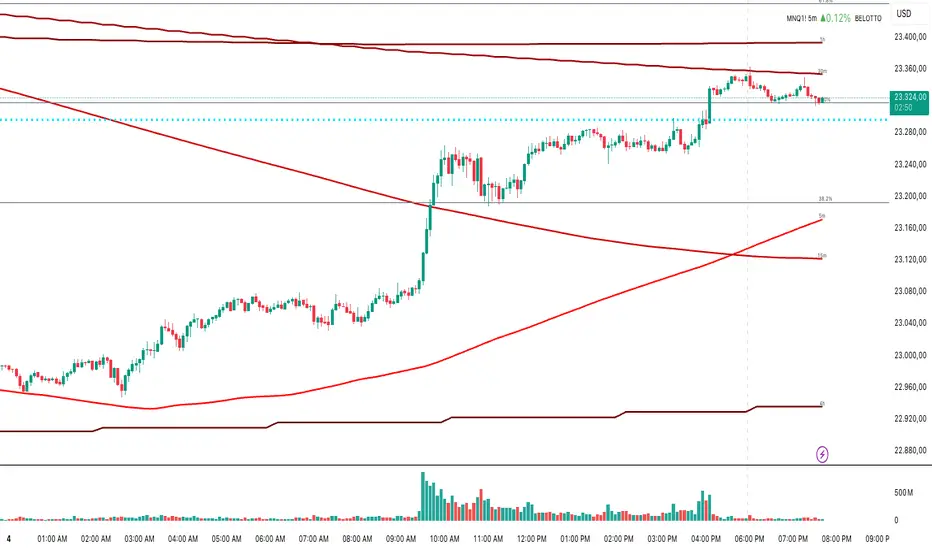
Multi-Timeframe MA 200Multi-Timeframe MA 200
This powerful tool plots the 200-period Moving Average across multiple timeframes (5m, 15m, 30m, 1h, 4h, Daily) directly on your active chart. You can switch between SMA (Simple Moving Average) and EMA (Exponential Moving Average) for all timeframes at once.
Key features:
✅ 100% accurate calculation using the original timeframe
✅ Option to choose SMA or EMA
✅ Visual smoothing for cleaner display
✅ Floating labels showing the origin timeframe
✅ Clean interface – no clutter or legends
✅ Ideal for scalping, intraday, and swing traders
Developed by BELOTTO TRADER, founder of the CLUBE DO GAIN – one of the most engaged trading communities in the Portuguese-speaking world.
SHYY TFC Candles_Confirmation X 4TF)SHYY Real-Time FTC Confirmation is a multi-timeframe trend alignment tool designed to provide real-time confirmation of market direction across up to four configurable timeframes. Unlike traditional tools that rely on closed candles, this version uses in-progress bars to detect live momentum, allowing traders to respond as trends are forming rather than after they are confirmed.
This script checks the current price direction on each selected timeframe by comparing the current close to the open of the same candle. A timeframe is considered bullish if the close is above the open, bearish if below, and neutral if equal. If all enabled timeframes are aligned in the same direction, the current chart candle is colored accordingly.
White candles indicate that all selected timeframes are currently bullish. Yellow candles indicate that all selected timeframes are currently bearish. If the timeframes are not fully aligned, the candle remains uncolored.
Each of the four timeframes can be configured individually in the settings panel. Users can also enable or disable each timeframe independently using checkboxes, allowing flexibility in how the confirmation logic is applied.
The script uses a single request.security() call per timeframe with lookahead enabled, so that the information shown reflects the live status of each timeframe’s bar, not just completed ones. This makes it suitable for real-time decision-making and strategy filtering.
This tool can assist scalpers, trend followers, and breakout traders in aligning trades with broader market direction. It can be used as a standalone trend filter or in conjunction with other indicators and strategies.
No external dependencies or overlays are required.
This is an original script, built to provide real-time, multi-timeframe confirmation using a clean and efficient approach.

Time-based Alerts for Trading Windows🌟 Time-based Alerts for Trading Windows 🌐📈
This is a re-uploaded script as the previous one got hidden.
This Time-based Alerts for Trading Windows script is a highly customizable and reliable tool designed to assist traders in managing automated strategies or manually monitoring specific market conditions. Inspired by CrossTrade's Time-based Alert, this script is tailored for those who rely on precise time windows to trigger actions, such as sending webhook signals or managing Expert Advisors (EAs).
Whether you are a scalper, day trader, or algorithmic trader, this script empowers you to stay on top of your trades with fully customizable time-based alerts.
🛠️ Customizable Time Alerts
This indicator allows you to create up to 12 unique time windows by specifying the exact hour and minute for each alert. Each time window corresponds to an individual alert condition, making it perfect for managing trades during specific market sessions or key time periods.
For example:
Alert 1 can be set at 9:30 AM (market open).
Alert 2 can be set at 3:55 PM (just before market close).
Each alert can be toggled on or off in the indicator settings, allowing you to manage alerts without having to reconfigure your script.
You can adjust the colours to fit any colour scheme you like!
🕒 Odd and Even Time Alerts
The script comes with three built-in alert type categories:
Odd Alerts (marked with a green triangle on the chart): These correspond to odd-numbered inputs like Alert 1, Alert 3, Alert 5, and so on.
Even Alerts (marked with a red triangle on the chart): These correspond to even-numbered inputs like Alert 2, Alert 4, Alert 6, and so on.
You can also customize all 12 alerts individually to include a custom alert message
These alerts serve as a convenient way to differentiate between multiple trading strategies or market conditions. You can customize alert messages for odd and even alerts directly from TradingView’s alert panel.
🔗 Webhook Integration for Automation
This script is fully compatible with webhook-based automation. By configuring your alerts in TradingView, you can send signals to trading bots, EAs, or any third-party system. For example, you can:
Turn off an EA at a specific time (e.g., 3:55 PM EST).
Send buy/sell signals to your bot during predefined trading windows.
Simply use TradingView’s alert message editor to format webhook payloads for your automation system.
🌐 Timezone Flexibility
Trading happens across multiple time zones, and this script accounts for that. You can toggle between:
Eastern Time (New York): Ideal for most US-based markets.
Central Time (Exchange): Useful for futures and commodities traders.
This ensures your alerts are always in sync with your preferred time zone, eliminating confusion.
🎨 Visual Indicators
The script plots visual markers directly on your chart to indicate active alerts:
Up Facing Triangles: Represent odd-numbered alerts, providing a quick reference for these time windows.
Down Facing Triangles: Represent even-numbered alerts, helping you track different strategies or conditions.
These visual markers make it easy to see when alerts are triggered, even at a glance.
📈 Practical Use Case
Let’s say you’re trading the USTEC index on a 1-minute chart. You want to:
Turn off your trading bot at 16:55 EST to avoid after-market volatility.
Trigger a re-entry signal at 17:30 EST to capture moves during the Asian session.
Visually monitor these actions on your chart for easy reference.
This script makes it possible with precision alerts and webhook integration. Simply configure the time windows in the settings and set up your alerts in TradingView.
🚨 How to Set Up Alerts
Enable or Disable Alerts: Use the script’s settings to toggle specific alerts on or off as needed.
Set Custom Time Windows: Define the hour and minute for each alert in the settings panel.
Create Alerts in TradingView:
Go to the TradingView alert panel.
Select the condition (e.g., "Odd Time-based Alert (Green)" or "Even Time-based Alert (Red)").
Customize the alert message for webhook integration or personal notification.
Choose the trigger type: Once Per Bar or Once Per Bar Close to keep the alert active.
Integrate with Webhooks: Use the alert message field to format payloads for automation systems like MT4, MT5, or third-party bots.
📋 Key Notes
Alerts can trigger indefinitely if set to "Once Per Bar" or "Once Per Bar Close".
Always ensure the expiration date is set far in the future to avoid unexpected alert deactivation.
Test webhook messages and alert configurations thoroughly before using them in live trading.
This script is a powerful addition to your trading toolbox, offering precision, flexibility, and automation capabilities. Whether you’re turning off an EA, managing trades during market sessions, or automating strategies via webhooks, this script is here to support you.
Start using the Time-based Alerts for Trading Windows today and trade with confidence! 🚀✨

MultiTime Stochastics ProMultiTime Stochastics Pro
This indicator is an enhanced version of the stochastic indicator, featuring two separate stochastics. This functionality allows you to adjust the settings and time frame for each stochastic individually, enabling a more precise analysis of market fluctuations.
The Double Stochastic indicator enables you to simultaneously analyze the market in different time frames with two separate stochastics. One of the standout features of this indicator is that when the chart's time frame changes, each stochastic is displayed according to the time set for it and does not change in other time frames. This feature provides greater flexibility and accuracy in market analysis.
How the Indicator Works
This indicator calculates two separate stochastics:
The first stochastic (K1 and D1) with its own specific time frame and settings.
The second stochastic (K2 and D2) with a different time frame and settings.
These two stochastics are displayed simultaneously on one chart, and overbought and oversold lines are also included.
How to Use
Parameter Adjustment : Adjust the parameters K1 Length, D1 Smoothing, and K1 Time Frame as desired. Do the same for the second stochastic.
Signal Analysis : Analyze buy and sell signals based on the stochastic values and the overbought and oversold lines.
Advantages
Greater Precision : With two separate stochastics, you can follow market fluctuations with greater accuracy.
Flexibility : The ability to individually set the time frame and parameters for each stochastic makes this indicator highly flexible.
Stronger Signals : The simultaneous display of two stochastics allows you to receive stronger buy and sell signals.
Multi-time frame Analysis : The ability to analyze the market in different time frames simultaneously.
This indicator is suitable for traders seeking more precise and flexible market analysis tools. I hope these explanations help you publish your indicator in the best possible way!

Multi-Assets Monthly/Weekly/Daily/ Rate Multi-Assets Rate Indicator
This indicator provides a comprehensive view of performance across multiple asset classes, including Forex pairs, Indices, Commodities, and Cryptocurrencies. It offers the following features:
1. Asset Type Selection: Users can choose between "FOREX" and "Other Assets" to view different sets of instruments.
2. Timeframe Flexibility: Performance can be analyzed on Weekly, Daily, or Monthly timeframes.
3. Performance Metrics:
- Current Period Performance: Percentage change in the selected timeframe.
- Previous Period Performance: Percentage change in the previous period.
- Rate of Change: Difference between current and previous period performances.
4. Visual Representation: Results are displayed in a color-coded table for easy interpretation.
- Green indicates positive performance
- Red indicates negative performance
5. Customizable Symbols: Users can input their preferred symbols for each category.
6. Categorized View: When "Other Assets" is selected, the table is organized into Indices, Commodities, and Cryptocurrencies for better clarity.
This indicator is designed to help traders and investors quickly assess and compare performance across various financial instruments and asset classes. It's particularly useful for identifying trends, comparing relative strengths, and making informed decisions based on multi-timeframe analysis.
Note: This indicator relies on data provided by TradingView. Ensure that you have access to the required data feeds for accurate results.
Disclaimer: This indicator is for informational purposes only and should not be considered as financial advice. Always conduct your own research and consider your financial situation before making investment decisions.

BINANCE-BYBIT Cross Chart: Spot-Perpetual CorrelationName: "Binance-Bybit Cross Chart: Spot-Perpetual Correlation"
Category: Scalping, Trend Analysis
Timeframe: 1M, 5M, 30M, 1D (depending on the specific technique)
Technical analysis: This indicator facilitates a comparison between the price movements shown on the Binance spot chart and the Bybit perpetual chart, with the aim of discerning the correlation between the two charts and identifying the dominant market trends. It automatically generates the corresponding chart based on the ticker selected in the primary chart. When a Binance pair is selected in the main chart, the indicator replicates the Bybit perpetual chart for the same pair and timeframe, and vice versa, selecting the Bybit perpetual chart as the primary chart generates the Binance spot chart.
Suggested use: You can utilize this tool to conduct altcoin trading on Binance or Bybit, facilitating the comparison of price actions and real-time monitoring of trigger point sensitivity across both exchanges. We recommend prioritizing the Binance Spot chart in the main panel due to its typically longer historical data availability compared to Bybit.
The primary objective is to efficiently and automatically manage the following three aspects:
- Data history analysis for higher timeframes, leveraging the extensive historical data of the Binance spot market. Variations in indicators such as slow moving averages may arise due to differences in historical data between exchanges.
- Assessment of coin liquidity on both exchanges by observing candlestick consistency on smaller timeframes or the absence of gaps. In the crypto market, clean charts devoid of gaps indicate dominance and offer enhanced reliability.
- Identification of precise trigger point levels, including daily, previous day, or previous week highs and lows, which serve as sensitive areas for breakout or reversal operations.
All-Time High (ATH) and All-Time Low (ATL) levels may vary significantly across exchanges due to disparities in historical data series.
This tool empowers traders to make informed decisions by leveraging historical data, liquidity insights, and precise trigger point identification across Binance Spot and Bybit Perpetual market.
Configuration:
EMA length:
- EMA 1: Default 5, user configurable
- EMA 2: Default 10, user configurable
- EMA 3: Default 60, user configurable
- EMA 4: Default 223, user configurable
- Additional Average: Optional display of an additional average, such as a 20-period average.
Chart Elements:
- Session separator: Indicates the beginning of the current session (in blue)
- Background: Indicates an uptrend (60 > 223) with a green background and a downtrend (60 < 223) with a red background.
Instruments:
- EMA Daily: Shows daily averages on an intraday timeframe.
- EMA levels 1h - 30m: Shows the levels of the 1g-30m EMAs.
- EMA Levels Highest TF: Provides the option to select additional EMA levels from the major timeframes, customizable via the drop-down menu.
- "Hammer Detector: Marks hammers with a green triangle and inverted hammers with a red triangle on the chart
- "Azzeramento" signal on TF > 30m: Indicates a small candlestick on the EMA after a dump.
- "No Fomo" signal on TF < 30m: Indicates a hyperextended movement.
Trigger Points:
- Today's highs and lows: Shows the opening price of the day's candlestick, along with the day's highs and lows (high in purple, low in red, open in green).
- Yesterday's highs and lows: Displays the opening price of the daily candlestick, along with the previous day's highs and lows (high in yellow, low in red).
You can customize the colors in "Settings" > "Style".
It is best used with the Scalping The Bull indicator on the main panel.
Credits:
@tumiza999: for tests and suggestions.
Thanks for your attention, happy to support the TradingView community.

Timeframe Marker - know when timeframes start/end
When you're on a lower timeframe, it's important to know which timeframes are starting/ending.
Timeframe Marker will display a bars that stack notifying you of your chosen timeframes.
For example, if you're on the one minute chart or another low timeframe, you'll be aware of the larger timeframes are about to begin or start.
It's always good to select the lowest timeframe first in ascending order so that the lowest bar is the lowest timeframe and bars that stack on top are larger timeframes.
The default timeframes are:
• 5 minutes (green)
• 15 minutes (yellow)
• 1 hour (orange)
• 4 hour (red)
• daily (blue)
• weekly (purple)
• monthly (gray)
If your chart's timeframe is higher than the timeframe marker you've selected, then it won't display a bar stack for that timeframe as it would normally display on every bar (this is to avoid clutter).
The future timeframe marks basically will offset to future timeframes. Set how many bars forward you'd like to see.

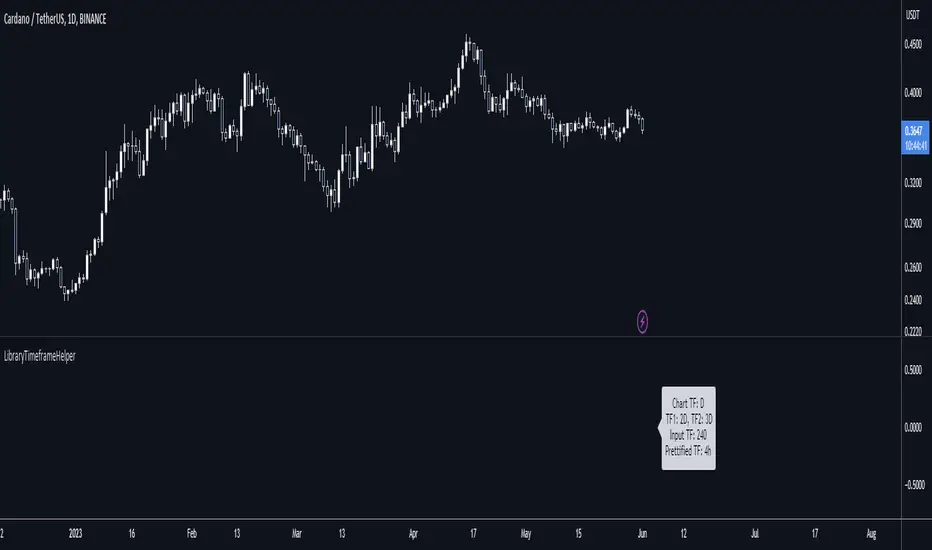
LibraryTimeframeHelperLibrary "LibraryTimeframeHelper"
Helper functions to work with timeframes: to get the next higher TF, and to make the string pretty for use in labels. Perhaps I'll add more later.
f_getHigherTF(_TF)
f_getHigherTF(): Converts the input timeframe into the next one up in the list of commonly used timeframes. NOTE: You can NOT use a TF from this function as input to a request.security() call if called from this library because it gets converted to a series (since there's nothing special about this function, I expect this probably goes for any library). However, you CAN copy the code and use it directly in your script, in which case the output is only a simple variable and thus suitable for the timeframe of a request.security() call.
Parameters:
_TF (string) - The timeframe to convert.
Returns: : A string in standard timeframe format.
f_prettifyTF(_TF)
f_prettifyTF(): Converts the input timeframe from standard timeframe format to the format shown by TradingView on a chart. The output is not suitable for use as an input timeframe of a request.security() call.
Parameters:
_TF (string) - The timeframe to convert.
Returns: : A string in prettified timeframe format.
Bender Stochastic MTF With Buy & Sell SignalsA stochastic indicator is a technical analysis tool that uses random data points to forecast price changes in a financial security. It compares the closing price of a security to its price range over a set period of time. The indicator is designed to indicate when a security is overbought or oversold by comparing the closing price to the price range over a certain number of periods. A stochastic indicator can be used to identify potential buying or selling opportunities. It is often used in conjunction with other technical analysis tools to provide a more comprehensive analysis of market conditions.
Configurable Indicator Signals
Signal on k & d Stochastic Line Crosses
Invalidate Signal if not in a overbought or oversold pressure zone
Invalidate signal on neutral zone breach
Invalidate signal on reverse cross
Invalidate signal after a user set number of bars
Delay signal until the cross is considered strong by calculating the distance between the stochastic lines the a user set threshold
Please Note:
This indicator is also embedded in the Bender Bot strategy script. Signals and confluence identified by this indicator can be used to autonomously mange strategies. The below settings will not have any effect on this indicator's functionality when used as a stand alone indicator.
Bender Bot Strategy Confluence
Close any open trade on reverse k & d Stochastic line crosses
Require any signal and Stochastic directional confluence before opening any trade
Require any signal and Stochastic pressure to be in confluence before opening any trade
Require any signal to be in directional confluence with the Stochastic signal

Bender Money Flow Index MTF with Buy & Sell SignalsMFI = Money Flow Index
MTF = Multi Timeframe
The Money Flow Index (MFI) is a technical indicator that can generate sentiment insight or pressure using both price and volume data.
Configurable Indicator Signals
Signal on MFI line directional changes
Invalidate Signal if not in a overbought or oversold pressure zone
Invalidate signal if MFI line is not in confluence with the moving average
Invalidate signal after a defined number of bars in the opposing direction
Please Note:
This indicator is also embedded in the Bender Bot strategy script. Signals and confluence identified by this indicator can be used to autonomously mange strategies. The below features will not have any effect on this indicator's functionality when used as a stand alone indicator.
Bender Bot Strategy Confluence
Require any signal and MFI directional confluence before opening any trade
Require any signal and MFI and Moving average to be in confluence before opening any trade
Require any signal to be in directional confluence with the full MFI signal
Please feel free to contact me with any questions or concerns.

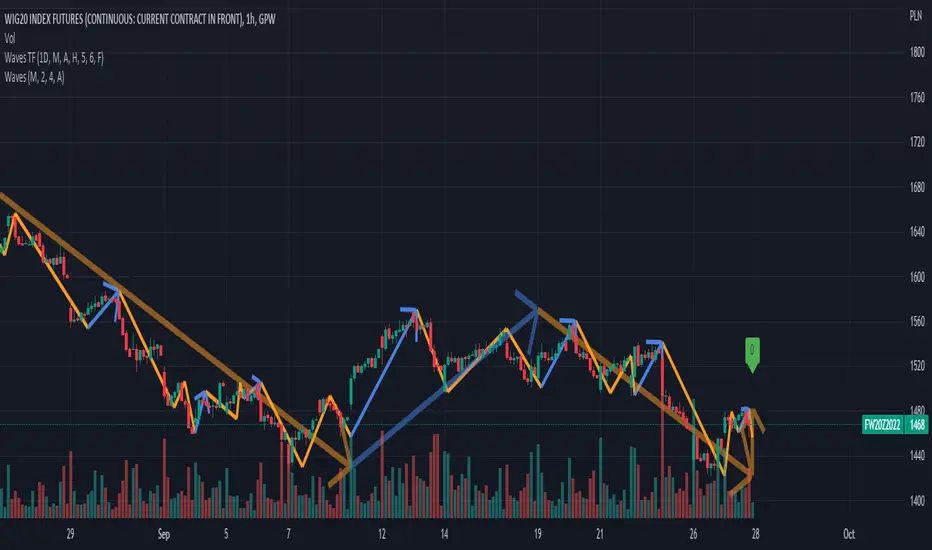
Waves TimeframeCustom timeframe trend wisualization tool in Wave theory. In script setting you can specify based on which timeframe (1D by default) data visaulizaction will be made. It's usefull in short time/day traiding where on the small interval you would like to see more global/bigger interval situation. If it's you case, please check "Waves Pro Trends", that gives posibility to easie check up to 3 different intervals.
Script settings:
• Timeframe – The interval based on which waves are calculated. Script is working correct only for intervals that are equal or more precise than picked here value. In case of picking lower interval than current, error message will appear.
• Type – Type of waves that are drawn:
o H(ide) – Not drawing any waves
o L(ow) – Drawing low level waves
o M(edium) – Drawing mid level waves
o B(oth) – Drawing both low and mid level waves
• Alfred – Showing extra informations about waves in the context of current candle.
• Wave – How script should visualize wave:
o H(ide) - Not drawing waves.
o S(olid line) – Drawng as solid line
o A (Solid line with Arrow) – Drawing as solid line with arrow
o D(otted line) – Drawing as dotted line.
• Shadow – How script should visualise wave shadows. Waves shadow it's a drawing mode in which wave is draw based on it's extrems instead of moment od detection.
o H(ide) - Do not draw any shadows
o S(olid line) – Draw with a solid line
o A (Solid line with Arrow) – Draw as solid line with arrorw
o D(otted line) – Draw as dotted line
• Low line – Color and line width for low level waves
• Medium line – Color and line width for mid level waves
• Impuls – Color and picking impuls mode:
o H(idden) – Do not show impuls
o F(irst) – Impuls is draw starting from the first wave up
o S(econd) – Impuls jis draw starting from the second wave up
o Auto – The algorithm performs an automatic analysis and selects which of the impulse drawing methods presents impulses with greater price dynamics.
RSI + GDAX EMA ConfluencerHighly customizable RSI + GDAX EMA tool to help you quickly spot levels of confluence
- Displays current RSI levels as a plot
- Displays current 12 + 26 EMA as a plot
- 7 customizable time frames
- Each time frame marks RSI oversold, RSI overbought, 12 EMA, and 26 EMA as a line with label
- Each time frame RSI and EMA have options to toggle visibility and oversold/overbought only so you can choose exactly what you want to see
Planned for future release:
- Further customization for lines (color, size, direction, etc)
- Further customization for labels (location, offset, color, size, etc)
- Highlighting areas of confluence (if 2-3+ lines are within a certain % of each other)

All TimeFrame OscillatorsI have always fighted to understand the market direction because it looks different on different timeframes.
I wanted an indicator where I can see all the different timeframes at once.
This indicator shows already existing oscillators but not only in the current chart's timeframe, but all the most important higer timeframes at once.
I have started with the stoch, then added as many oscillators as I could.
Experimenting with this I have saw that confluence of 4H 1D and 1W Stoch can be very interesting and can highlight higher timeframe take profit areas and sometimes major tops/bottoms.
Also bounces can be interesting when a lower timeframe stoch is bounced or rejected from a higher one.
Oscillators:
Stoch - Stochastic Oscillator
SMI - Stochastic Momentum Index
Rsi - Relative Strength Index
StochRsi - Stochastic RSI
WaveTrend - Vumanchu alias Market Cypher Wave Trend line
CCI - Commodity Channel Index
CCIStoch - Stochastic CCI
Williams Percent Range - Williams %R
Norm. MACD - Normalized Moving Average Convergence Divergence
Norm. MACD Hist - Normalized MACD Histogramm
PVT - Normalized Price Volume Trend
MFI - Money Flow Index
CMF - Chaikin Money Flow
Chande Momentum - Chande Momentum
Volume - Normalized Volume
CandleValue - Vumanchu alias Market Cypher MoneyFlow
BBWP - Bollinger Band Width Percentile
Line Type
Smooth: lines are smoothed, but the actualy not closed values are not shown
Step: Step lines, the actually open timeframes are calculated as they closed at the current values
Plot Oscillator or it's Slope:
its possible to not plot the oscillator but it's slope
Print dots when:
Cross Up/Down oversold/overbougt level - best for most oscillators. for example when Stoch crosses above 20 or below 80
Cross os/ob and the one higher TF is about to cross - when it's crosses beolw 80 and the higher timeframe oscillator is still above ans sloping down
Cross above/below middle line - for example on RSI being above or below 50 can be interesting
Print triangles when:
All Slope Match - all visible timeframe lines are pointing up or down at the same time
All above/belove middle line - all visible lines are above or belove the middle line
All above/belove middle line and slope match - like the previous one and the slope direction is the same
All above/below oversold/overbougt - all lines are above or below os/ ob. this is the default. it can be a very important confluence
Lower TF in order - 5, 15, 30, 60 minute timeframes are in order.
Higher TF in order - 4H 1D 1W in order (like 4H above 1D abd 1D above 1W). can be interesting at RSI
4H-1D in order - 4H 1D in order .
Print triangles
Print all triangles - print all triangles when the condition is met
Print only first triangles - only show when the condition starts to met
Print only last triangles - small triangles when the condition met first, large when last. tis is the default.
Timeframes to show:
You can turn on/off different timeframs to show or not from the list below:
1m 5m 15m 30m 1H 4H D 5D W M
This is for experimenting/ understanding the market direction on multiple timeframes at once.
Don't take it's signals (and any other indicator's) as exact trade signals. use it as confirmation instead.
Any comments, insights, ideas are welcome.

Multi EMA with labels (Any timeframe)This script lets you add up to 8 EMAs (Exponential Moving Averages) that can be set to any timeframe and length. The difference between this and other EMA indicators is that it has a simple label attached to each EMA showing which timeframe it belongs to and what length it is, so you can get that information at a glance while trading without having to remember the specific settings for each EMA.
I was personally looking for something like this because I like clarity on my chart and these labels really help. The existing EMA indicators I found with labels don't support multiple timesframes or if they do, they don't include the timeframe itself in the label, so that's why I created this simple script and shared it in case somebody else is looking for the same. Enjoy.

Timeframed Moving Average RibbonAdded timeframe inputs for each of the moving averages in the stock TradingView Moving Average Ribbon indicator.
Now one can use a combination of different moving averages such as the following without readjusting the indicator's settings when switching the chart's timeframes:
- 390 period 5 minute (5 day equivalent) SMA
- 150 period 1 day (30 week equivalent) EMA
- 200 period 1 week (50 month equivalent) SMA
- 50 period chart timeframe SMA
- 100 period chart timeframe SMA
- 200 period chart timeframe SMA

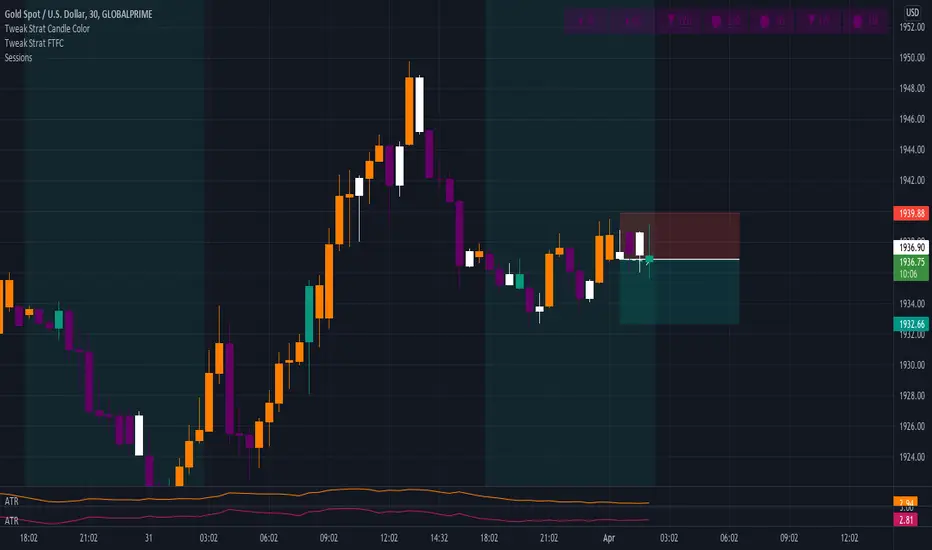
Tweak Strat FTFCThis script allows traders to view timeframe continuity on 7 timeframes at the top of the chart.
The trader selects 7 different timeframes, and the script will reflect whether the current candle for each timeframe is bullish or bearish (current price > the open OR current price < the open).
If a timeframe is currently bearish, the box will be purple.
If a timeframe is currently bullish, the box will be orange.
A circle in the middle of the box indicates that that timeframe is currently an inside bar (1).
An upward arrow indicates that that timeframe is currently a directional up bar (2u).
A downward arrow indicates that that timeframe is currently a directional down bar (2d).
A rectangle indicates that that timeframe is currently an outside bar (3).
NOTE: The color of the boxes is fixed. Traders MUST select a timeframe for EACH OF THE 7 FIELDS.
Hull MA TimeFrame CrossOverHello traders,
Although this strategy is configured on BTCUSDT , with a changing of settings, it can be used on any trading instrument.
Here it is seen, on the 2 hour chart. With Trading Fees included in result (adjust to suit your exchange fees).
The candle crossover is set to Daily timeframe.
That means that the Candle crossover is going to see if todays price is higher than yesterdays price.
If user sets this to 4 hour timeframe, the candle crossover would be when price is higher than the the price 4 hours ago...
The rest is simple, a moving average to detect direction, and an ATR StopLoss (if activated).
There is StopLoss and Take Profit settings which work by percentage.
The periods of the moving average and the ATR can be adjusted, as can the TP % and SL %.
The price is taken from the CLOSE or the OPEN or OHLC4 etc... which can be changed in the settings. OPEN is recommended to avoid repainting.
The moving average also has selectable types (ALMA,SMA,EMA,WMA,HMA)
So if the Price is above the Moving average, and the moving average is above the alternate timeframe value, then a buy is activated
if the Price is below the Moving average, and the moving average is below the alternate timeframe value, then a sell is activated
if OPEN is selected as Price source, then the alternate timeframe value would be the OPEN of the alternate timeframes candle.
the values are all plotted on chart so user can see what is happening when what crosses over what, and then what changes when settings are adjusted.
Have FuN!
if this strategy brings you the epik win......
.... dont forget about me
seaside420 ❤️
