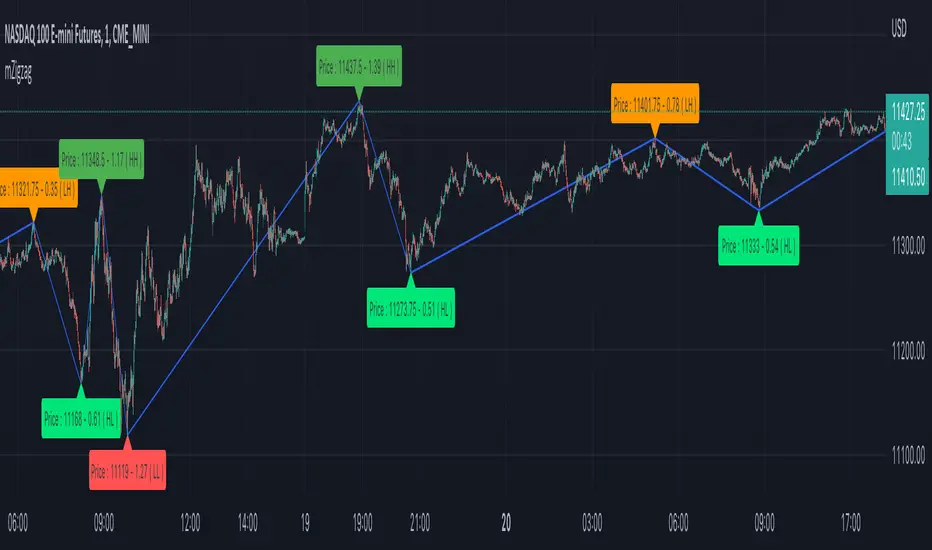
BinaryInsertionSortLibrary "BinaryInsertionSort"
Library containing functions which can help create sorted array based on binary insertion sort.
This sorting will be quicker than array.sort function if the sorting needs to be done on every bar and the size of the array is comparatively big.
This is created with the intention of using this to solve a bigger problem posted by @lejmer. Wish me luck!!
binary_insertion_sort(sortedArray, item, order)
binary insertion sort - inserts item into sorted array while maintaining sort order
Parameters:
sortedArray : array which is assumed to be sorted in the requested order
item : float|int item which needs to be inserted into sorted array
order : Sort order - positive number means ascending order whereas negative number represents descending order
Returns: int index at which the item is inserted into sorted array
update_sort_indices(sortIndices, newItemIndex)
adds the sort index of new item added to sorted array and also updates existing sort indices.
Parameters:
sortIndices : array containing sort indices of an array.
newItemIndex : sort index of new item added to sorted array
Returns: void
get_array_of_series(item, order)
Converts series into array and sorted array.
Parameters:
item : float|int series
order : Sort order - positive number means ascending order whereas negative number represents descending order
Returns:
get_sorted_arrays(item, order)
Converts series into array and sorted array. Also calculates the sort order of the value array
Parameters:
item : float|int series
order : Sort order - positive number means ascending order whereas negative number represents descending order
Returns:
Trendoscope
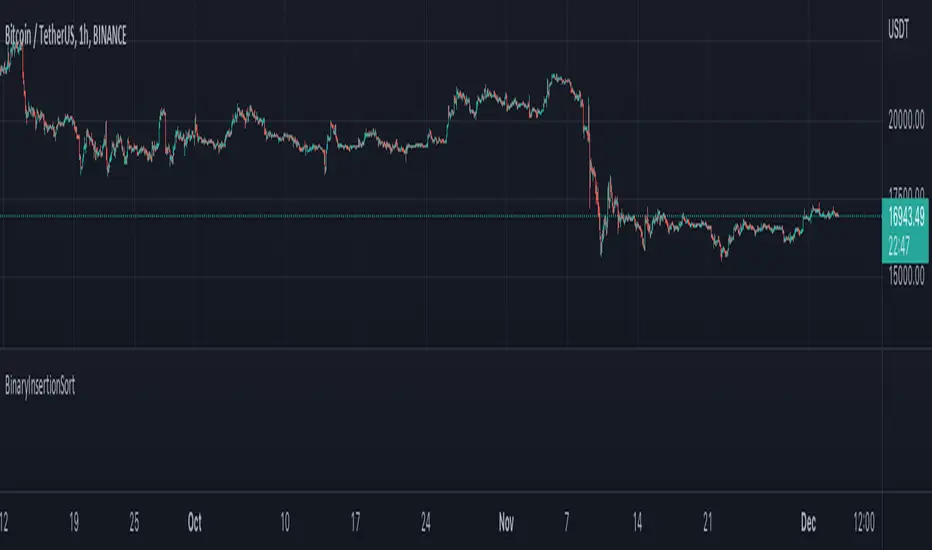
Electrocardiogram ChartThis is an attempt to develop alternative visualisation of financial charts. This script also makes use of new pine feature types which represents User Defined Object Types. You can refer to below documentation to understand more about this feature:
www.tradingview.com
www.tradingview.com
🎲 Structure of new chart components
🎯Instead of candles/bars, this type of chart contains Electrocardiogram blocks which resembles the heartbeat signals on electrocardiogram.
Body color of the block is defined by the open and close prices of the bar. If close is greater than open, body is green. Otherwise, the body is painted red.
Border color of the block is defined by the close prices of current and previous bar. If the close of current bar is greater than that of last bar, then the border color is green. Otherwise, border color is painted red.
🎯Inside each blocks there will be 5 connecting lines called the signal lines.
open-open
open-firstPeak(high or low of the bar whichever comes first)
firstPeak-secondPeak(high or low of the bar whichever comes last)
secondPeak-close
close-close
🎯 Color of the signal lines are determined by which among the high/low of the bar comes last. If highest part of the bar reached after reaching the lowest part of the bar, then signal lines are coloured green signifying bullish sentiment towards the end of bar. If lowest part of the bar reached after reaching the highest part of the bar, then signal lines are coloured red signifying bearish sentiment towards the end of bar.
Pictorial examples here:
🎲 Limitations with pinescript implementation
Since, pinescript can only use maximum 500 lines and each block will take 1 box and 5 lines, it is not possible to display more than 100 bars.
Each block of new Electrocardiogram chart will take the space of 7 bars of candlestick chart. Due to this, the alignment of regular OHLC candles is not inline with the new chart type. Background highlighting is done for the part of the OHLC candles where Electrocardiogram blocks are plotted so that it helps users to map the bars manually
Thanks to @theheirophant for suggestion of name :)

taLibrary "ta"
Collection of all custom and enhanced TA indicators. Same as enhanced_ta. But, removed all the displays to make it faster.
ma(source, maType, length)
returns custom moving averages
Parameters:
source : Moving Average Source
maType : Moving Average Type : Can be sma, ema, hma, rma, wma, vwma, swma, highlow, linreg, median
length : Moving Average Length
Returns: moving average for the given type and length
atr(maType, length)
returns ATR with custom moving average
Parameters:
maType : Moving Average Type : Can be sma, ema, hma, rma, wma, vwma, swma, highlow, linreg, median
length : Moving Average Length
Returns: ATR for the given moving average type and length
atrpercent(maType, length)
returns ATR as percentage of close price
Parameters:
maType : Moving Average Type : Can be sma, ema, hma, rma, wma, vwma, swma, highlow, linreg, median
length : Moving Average Length
Returns: ATR as percentage of close price for the given moving average type and length
bb(source, maType, length, multiplier, sticky)
returns Bollinger band for custom moving average
Parameters:
source : Moving Average Source
maType : Moving Average Type : Can be sma, ema, hma, rma, wma, vwma, swma, highlow, linreg, median
length : Moving Average Length
multiplier : Standard Deviation multiplier
sticky : - sticky boundaries which will only change when value is outside boundary.
Returns: Bollinger band with custom moving average for given source, length and multiplier
bbw(source, maType, length, multiplier, sticky)
returns Bollinger bandwidth for custom moving average
Parameters:
source : Moving Average Source
maType : Moving Average Type : Can be sma, ema, hma, rma, wma, vwma, swma, highlow, linreg, median
length : Moving Average Length
multiplier : Standard Deviation multiplier
sticky : - sticky boundaries which will only change when value is outside boundary.
Returns: Bollinger Bandwidth for custom moving average for given source, length and multiplier
bpercentb(source, maType, length, multiplier, sticky)
returns Bollinger Percent B for custom moving average
Parameters:
source : Moving Average Source
maType : Moving Average Type : Can be sma, ema, hma, rma, wma, vwma, swma, highlow, linreg, median
length : Moving Average Length
multiplier : Standard Deviation multiplier
sticky : - sticky boundaries which will only change when value is outside boundary.
Returns: Bollinger Percent B for custom moving average for given source, length and multiplier
kc(source, maType, length, multiplier, useTrueRange, sticky)
returns Keltner Channel for custom moving average
Parameters:
source : Moving Average Source
maType : Moving Average Type : Can be sma, ema, hma, rma, wma, vwma, swma, highlow, linreg, median
length : Moving Average Length
multiplier : Standard Deviation multiplier
useTrueRange : - if set to false, uses high-low.
sticky : - sticky boundaries which will only change when value is outside boundary.
Returns: Keltner Channel for custom moving average for given souce, length and multiplier
kcw(source, maType, length, multiplier, useTrueRange, sticky)
returns Keltner Channel Width with custom moving average
Parameters:
source : Moving Average Source
maType : Moving Average Type : Can be sma, ema, hma, rma, wma, vwma, swma, highlow, linreg, median
length : Moving Average Length
multiplier : Standard Deviation multiplier
useTrueRange : - if set to false, uses high-low.
sticky : - sticky boundaries which will only change when value is outside boundary.
Returns: Keltner Channel Width for custom moving average
kpercentk(source, maType, length, multiplier, useTrueRange, sticky)
returns Keltner Channel Percent K Width with custom moving average
Parameters:
source : Moving Average Source
maType : Moving Average Type : Can be sma, ema, hma, rma, wma, vwma, swma, highlow, linreg, median
length : Moving Average Length
multiplier : Standard Deviation multiplier
useTrueRange : - if set to false, uses high-low.
sticky : - sticky boundaries which will only change when value is outside boundary.
Returns: Keltner Percent K for given moving average, source, length and multiplier
dc(length, useAlternateSource, alternateSource, sticky)
returns Custom Donchian Channel
Parameters:
length : - donchian channel length
useAlternateSource : - Custom source is used only if useAlternateSource is set to true
alternateSource : - Custom source
sticky : - sticky boundaries which will only change when value is outside boundary.
Returns: Donchian channel
dcw(length, useAlternateSource, alternateSource, sticky)
returns Donchian Channel Width
Parameters:
length : - donchian channel length
useAlternateSource : - Custom source is used only if useAlternateSource is set to true
alternateSource : - Custom source
sticky : - sticky boundaries which will only change when value is outside boundary.
Returns: Donchian channel width
dpercentd(useAlternateSource, alternateSource, length, sticky)
returns Donchian Channel Percent of price
Parameters:
useAlternateSource : - Custom source is used only if useAlternateSource is set to true
alternateSource : - Custom source
length : - donchian channel length
sticky : - sticky boundaries which will only change when value is outside boundary.
Returns: Donchian channel Percent D
oscillatorRange(source, method, highlowLength, rangeLength, sticky)
oscillatorRange - returns Custom overbought/oversold areas for an oscillator input
Parameters:
source : - Osillator source such as RSI, COG etc.
method : - Valid values for method are : sma, ema, hma, rma, wma, vwma, swma, highlow, linreg, median
highlowLength : - length on which highlow of the oscillator is calculated
rangeLength : - length used for calculating oversold/overbought range - usually same as oscillator length
sticky : - overbought, oversold levels won't change unless crossed
Returns: Dynamic overbought and oversold range for oscillator input
oscillator(type, length, shortLength, longLength, source, highSource, lowSource, method, highlowLength, sticky)
oscillator - returns Choice of oscillator with custom overbought/oversold range
Parameters:
type : - oscillator type. Valid values : cci, cmo, cog, mfi, roc, rsi, stoch, tsi, wpr
length : - Oscillator length - not used for TSI
shortLength : - shortLength only used for TSI
longLength : - longLength only used for TSI
source : - custom source if required
highSource : - custom high source for stochastic oscillator
lowSource : - custom low source for stochastic oscillator
method : - Valid values for method are : sma, ema, hma, rma, wma, vwma, swma, highlow, linreg, median
highlowLength : - length on which highlow of the oscillator is calculated
sticky : - overbought, oversold levels won't change unless crossed
Returns: Oscillator value along with dynamic overbought and oversold range for oscillator input
multibands(bandType, source, maType, length, useTrueRange, sticky, numberOfBands, multiplierStart, multiplierStep)
multibands - returns Choice of oscillator with custom overbought/oversold range
Parameters:
bandType : - Band type - can be either bb or kc
source : - custom source if required
maType : Moving Average Type : Can be sma, ema, hma, rma, wma, vwma, swma, highlow, linreg, median
length : - Oscillator length - not used for TSI
useTrueRange : - if set to false, uses high-low.
sticky : - for sticky borders which only change upon source crossover/crossunder
numberOfBands : - Number of bands to generate
multiplierStart : - Starting ATR or Standard deviation multiplier for first band
multiplierStep : - Incremental value for multiplier for each band
Returns: array of band values sorted in ascending order
mbandoscillator(bandType, source, maType, length, useTrueRange, stickyBands, numberOfBands, multiplierStart, multiplierStep)
mbandoscillator - Multiband oscillator created on the basis of bands
Parameters:
bandType : - Band type - can be either bb or kc
source : - custom source if required
maType : Moving Average Type : Can be sma, ema, hma, rma, wma, vwma, swma, highlow, linreg, median
length : - Oscillator length - not used for TSI
useTrueRange : - if set to false, uses high-low.
stickyBands : - for sticky borders which only change upon source crossover/crossunder for band detection
numberOfBands : - Number of bands to generate
multiplierStart : - Starting ATR or Standard deviation multiplier for first band
multiplierStep : - Incremental value for multiplier for each band
Returns: oscillator currentStates - Array containing states for last n bars

Next Pivot Projection [Trendoscope]Still experimental. Extending further on the divergence backtest results - in this script we try to project next 2 pivots (including one unconfirmed pivot)
🎲 Previous experiments
1. Divergence-Backtester
2. Divergence-Backtester-V2
🎲 Additions
Apart from collecting the stats on number of occurrences of HH, HL, LH, LL - this script also keeps track of average ratio for each levels and average bars.
Based on these data, we try to calculate the next pivot projections including possible bar and price.
Cloud covering the candles indicate historical levels of average HH, HL, LH, LL projections.
Hover on projection labels to find more details in tooltips.
🎲 Overall method in a nutshell
🎲 Going bit deeper
🎯 Unconfirmed Pivot and its projection - Last pivot of the zigzag is always unconfirmed. Meaning, it can potentially repaint based on further price movements. But, projection of the unconfirmed pivot will not change as it will be based on previous two pivots - both of which are confirmed.
🎯 Next Pivot Projection - Next pivot is projected based on last two pivots - which include last unconfirmed pivot. Hence, these projections can potentially repaint based on the last pivot repaint.
🎯 Historical projections displayed as cloud - Historical projection values are displayed as cloud around pivots.
A cloud above represents area from average lower high range to average higher high range. Cloud color is green if average ratio of pivot high is more than 1. Red Otherwise.
A cloud below represents area from average higher low range to average lower low range. Cloud color is red if average ratio of pivot high is more than 1. Green otherwise

Divergence Backtester - V2Further attempts to study divergence impact on price in shorter terms.
Previous study can be found here:
In this script, we are trying to gather the stats based on last two pivot state together. For example, Individual table of Pivot High Projection is as explained below:
But, by looking at the bigger picture, we can further estimate following things regarding the current unconfirmed pivot and the new pivot which is yet to be formed.

strategyLibrary "strategy"
Library containing few key calculations for strategy involving leveraged limit and stop orders
getQty(entry, stop, riskPercentage)
calculate qty and leverage based on entry and stop price for given risk percentage.
Parameters:
entry : Entry Price
stop : Stop Price
riskPercentage : risk percentage per trade
Returns: - Quantity based on the risk and calculated leverage on position including existing positions
bracketOrder(entry, stop, target, maxLeverage, isLimitOrder, riskPercentage)
Calculates position size based on risk and creates bracket orders for given entry/stop/target
Parameters:
entry : Entry Price
stop : Stop Price
target : Target Price
maxLeverage : Maximum leverage allowed
isLimitOrder : if true, places limit order for entry, else places stop order.
riskPercentage : risk percentage per trade
Returns: orderPlaced - true if orders successfully placed, false otherwise.
order(entry, stop, maxLeverage, isLimitOrder, riskPercentage)
Calculates position size based on risk and creates order for given entry/stop
Parameters:
entry : Entry Price
stop : Stop Price
maxLeverage : Maximum leverage allowed
isLimitOrder : if true, places limit order for entry, else places stop order.
riskPercentage : risk percentage per trade
Returns: orderPlaced - true if orders successfully placed, false otherwise.
Auto Harmonic Pattern - Extreme [Trendoscope]Publishing free to use scripts always brought me more value - be it in terms of more followers, or helped me to engage with people having right ideas. This has helped me immensely over past few years of my presence in tradingview. To all the coders out there who is starting to work on pinescript - my suggestion is to publish as many open source/free to use scripts as possible. It will always be rewarding experience and help you grow in a way you can never imagine.
Today, I realised that I have accumulated 10,000+ followers in tradingview just by learning and publishing what I learn. As token of gratitude to all our followers and supporters, we would like to gift this indicator. This is also tribute to all the people who have positively influenced our presence in tradingview and encouraged us to reach this level. Unfortunately cannot publish it as open source due to having proprietary code in it and fear of being misused.
I will not talk about the subject harmonic patterns as it is very generic and information is available online in many places. You can also refer to my open source libraries and scripts related to harmonic patterns. Some of them are here:
Libraries
eHarmonicpatternsExtended
eHarmonicpatterns
harmonicpatterns
Indicators
Harmonic-Patterns-Custom-Candles
Manual-Harmonic-Patterns-With-interactive-inputs
Manual-Harmonic-Projections-With-interactive-inputs
Auto-Harmonic-Patterns-V2
There are few more among open source and free scripts. But, will not mention them here as they are deprecated.
Now coming to the present indicator.
Setting are made simpler to enhance usability. This can also help new traders learning harmonic patterns. Snapshot of the settings can be found here:
Components of the script are as below
Please note, I may not be able to make any further update to this script. But, I promise never to degrade or reduce the quality of any free to use or open source script I ever published.

Extreme Trend Reversal Points [HeWhoMustNotBeNamed]Using moving average crossover for identifying the change in trend is very common. However, this method can give lots of false signals during the ranging markets. In this algorithm, we try to find the extreme trend by looking at fully aligned multi-level moving averages and only look at moving average crossover when market is in the extreme trend - either bullish or bearish. These points can mean long term downtrend or can also cause a small pullback before trend continuation. In this discussion, we will also check how to handle different scenarios.
🎲 Components
🎯 Recursive Multi Level Moving Averages
Multi level moving average here refers to applying moving average on top of base moving average on multiple levels. For example,
Level 1 SMA = SMA(source, length)
Level 2 SMA = SMA(Level 1 SMA, length)
Level 3 SMA = SMA(Level 2 SMA, length)
..
..
..
Level n SMA = SMA(Level (n-1) SMA, length)
In this script, user can select how many levels of moving averages need to be calculated. This is achieved through " recursive moving average " algorithm. Requirement for building such algorithm was initially raised by @loxx
While I was able to develop them in minimal code with the help of some of the existing libraries built on arrays and matrix , I also thought why not extend this to find something interesting.
Note that since we are using variable levels - we will not be able to plot all the levels of moving average. (This is because plotting cannot be done in the loop). Hence, we are using lines to display the latest moving average levels in front of the last candle. Lines are color coded in such a way that least numbered levels are greener and higher levels are redder.
🎯 Finding the trend and range
Strength of fully aligned moving average is calculated based on position of each level with respect to other levels.
For example, in a complete uptrend, we can find
source > L(1)MA > L(2)MA > L(3)MA ...... > L(n-1)MA > L(n)MA
Similarly in a complete downtrend, we can find
source < L(1)MA < L(2)MA < L(3)MA ...... < L(n-1)MA < L(n)MA
Hence, the strength of trend here is calculated based on relative positions of each levels. Due to this, value of strength can range from 0 to Level*(Level-1)/2
0 represents the complete downtrend
Level*(Level-1)/2 represents the complete uptrend.
Range and Extreme Range are calculated based on the percentile from median. The brackets are defined as per input parameters - Range Percentile and Extreme Range Percentile by using Percentile History as reference length.
Moving average plot is color coded to display the trend strength.
Green - Extreme Bullish
Lime - Bullish
Silver - range
Orange - Bearish
Red - Extreme Bearish
🎯 Finding the trend reversal
Possible trend reversals are when price crosses the moving average while in complete trend with all the moving averages fully aligned. Triangle marks are placed in such locations which can help observe the probable trend reversal points. But, there are possibilities of trend overriding these levels. An example of such thing, we can see here:
In order to overcome this problem, we can employ few techniques.
1. After the signal, wait for trend reversal (moving average plot color to turn silver) before placing your order.
2. Place stop orders on immediate pivot levels or support resistance points instead of opening market order. This way, we can also place an order in the direction of trend. Whichever side the price breaks out, will be the direction to trade.
3. Look for other confirmations such as extremely bullish and bearish candles before placing the orders.
🎯 An example of using stop orders
Let us take this scenario where there is a signal on possible reversal from complete uptrend.
Create a box joining high and low pivots at reasonable distance. You can also chose to add 1 ATR additional distance from pivots.
Use the top of the box as stop-entry for long and bottom as stop-entry for short. The other ends of the box can become stop-losses for each side.
After few bars, we can see that few more signals are plotted but, the price is still within the box. There are some candles which touched the top of the box. But, the candlestick patterns did not represent bullishness on those instances. If you have placed stop orders, these orders would have already filled in. In that case, just wait for position to hit either stop or target.
For bullish side, targets can be placed at certain risk reward levels. In this case, we just use 1:1 for bullish (trend side) and 1:1.5 for bearish side (reversal side)
In this case, price hit the target without any issue:
Wait for next reversal signal to appear before placing another order :)

ahpuhelperLibrary "ahpuhelper"
Helper Library for Auto Harmonic Patterns UltimateX. It is not meaningful for others. This is supposed to be private library. But, publishing it to make sure that I don't delete accidentally. Some functions may be useful for coders.
insert_open_trades_table_column(showOpenTrades, table_id, column, colors, values, intStatus, harmonicTrailingStartState, lblSizeOpenTrades)
add data to open trades table column
Parameters:
showOpenTrades : flag to show open trades table
table_id : Table Id
column : refers to pattern data
colors : backgroud and text color array
values : cell values
intStatus : status as integer
harmonicTrailingStartState : trailing Start state as per configs
lblSizeOpenTrades : text size
Returns: nextColumn
populate_closed_stats(ClosedStatsPosition, bullishCounts, bearishCounts, bullishRetouchCounts, bearishRetouchCounts, bullishSizeMatrix, bearishSizeMatrix, bullishRR, bearishRR, allPatternLabels, flags, rowMain, rowHeaders)
populate closed stats for harmonic patterns
Parameters:
ClosedStatsPosition : Table position for closed stats
bullishCounts : Matrix containing bullish trade stats
bearishCounts : Matrix containing bearish trade stats
bullishRetouchCounts : Matrix containing bullish trade stats for those which retouched entry
bearishRetouchCounts : Matrix containing bearish trade stats for those which retouched entry
bullishSizeMatrix : Matrix containing data about size of bullish patterns
bearishSizeMatrix : Matrix containing data about size of bearish patterns
bullishRR : Matrix containing Risk Reward data of bullish patterns
bearishRR : Matrix containing Risk Reward data of bearish patterns
allPatternLabels : array containing pattern labels
flags : display flags
rowMain : Pattern header data
rowHeaders : header grouping data
Returns: void
get_rr_details(patternTradeDetails, harmonicTrailingStartState, disableTrail, breakEvenTrail)
calculate and return risk reward based on targets and stops
Parameters:
patternTradeDetails : array containing stop, entry and targets
harmonicTrailingStartState : trailing point
disableTrail : If set, ignores trailing point
breakEvenTrail : If set, trailing does not go beyond breakeven.
Returns: nextColumn

Micro ZigzagMicro zigzag is created based on similar concepts as that of zigzag but by using lower timeframe intra-bar data. The lines join candle's high/low points but also depict how the price movement within the candle happened. That is, if the high of the candle is reached first, pivot from previous candle join the high first and then low and vice versa.
The output can also be viewed as advanced line chart.
🎲 Process
🎯 For every bar identify whether high came first or low by using lower timeframe data.
🎯 If high came before low, add high as high pivot first and then low as low pivot. If otherwise, add low as lower pivot first and then high as higher pivot.
🎯 When adding pivot, check if the last pivot is in the same direction as the new one. If yes, replace existing pivot if the new one goes beyond it. Ignore otherwise.
🎯 If the last pivot is of different direction as that one new one, then simple add the new pivot.

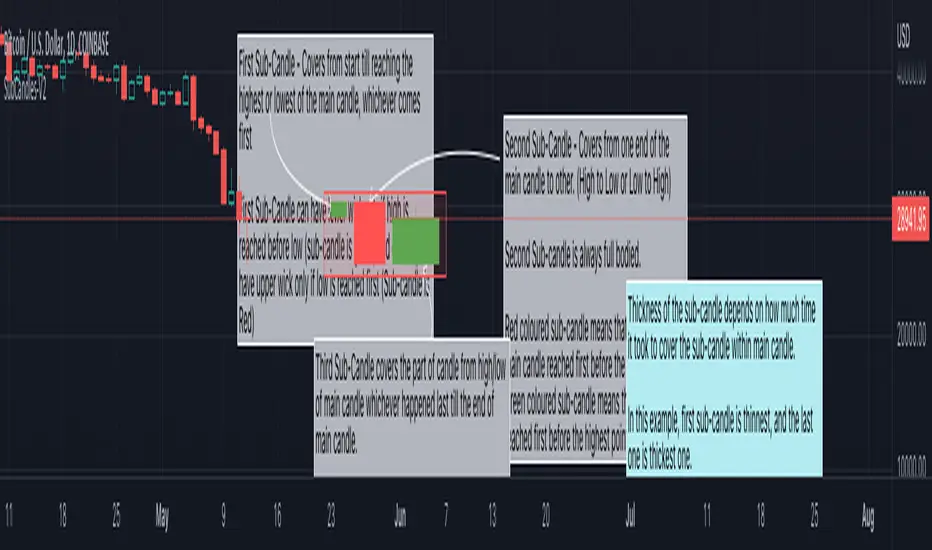
SubCandles-V2Further development on the sub-candle concept defined in the earlier script. SubCandle
This time instead of concentrating only on the last part, we are dividing the main candle into three parts.
First Sub-Candle - Covers the candle movement from open to first of highest/lowest point. First sub-candle tells how fast/slow the initial movement took place and which direction it went.
Second Sub-Candle - Is always a full bodied candle. Most important think here is the thickness of the sub-candle which tells how quickly or slowly the price went from one side of the peak to other.
Third Sub-Candle - Similar to first sub-candle but covers the last part. This part is similar to what we are depicting in the earlier version of Sub-Candle script.
Thickness of the sub-candle is based on relatively how much time each sub-candle took to complete within the main candle. Few interpretation can be:
If the first or third sub-candle are the thicker ones and if the thicker sub-candle has long wick, then it may mean strong rejection.
If the first or third sub-candle are thicker ones and if the thicker sub-candle has full body, it may mean higher volatility within the sub-candle.
If the second sub-candle is thicker than the rest - it can mean strong bias towards the direction of second sub-candle
Thinner second sub-candle may mean a dump/pump. May need to check third sub-candle to see if the dump/pump are followed by pump/dump
Also adding the screen shot reference below.
Note: This can repaint within bar. Use it as part of bar replay. Will try to add more option to select a particular candle without bar reply soon
Let me know what you think?
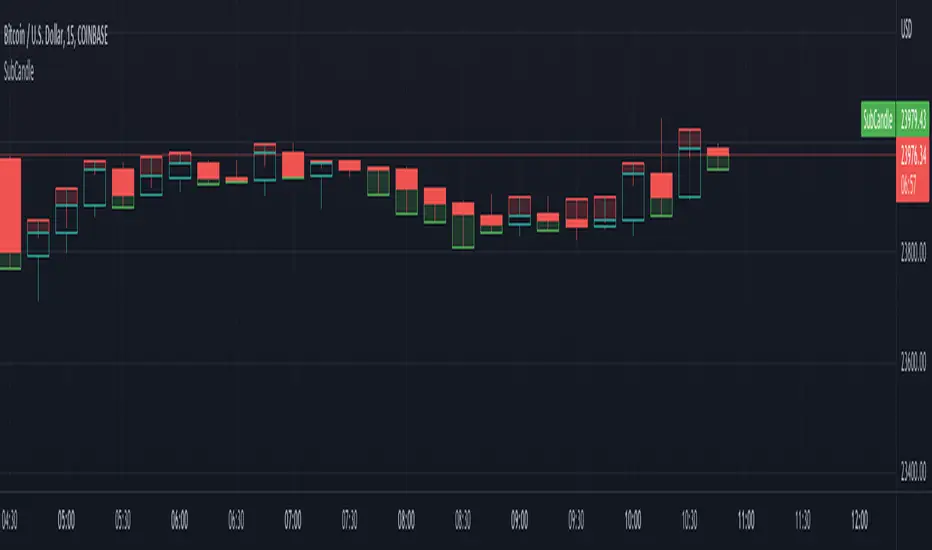
SubCandleI created this script as POC to handle specific cases where not having tick data on historical bars create repainting. Happy to share if this serves purpose for other coders.
What is the function of this script?
Script plots a sub-candle which is remainder of candle after forming the latest peak.
Higher body of Sub-candle refers to strong retracement of price from its latest peak. Color of the sub-candle defines the direction of retracement.
Higher wick of Sub-candle refers to higher push in the direction of original candle. Meaning, after price reaching its peak, price retraced but could not hold.
Here is a screenshot with explanation to visualise the concept:
Settings
There is only one setting which is number of backtest bars. Lower timeframe resolution which is used for calculating the Sub-candle uses this number to automatically calculate maximum possible lower timeframe so that all the required backtest windows are covered without having any issue.
We need to keep in mind that max available lower timeframe bars is 100,000. Hence, with 5000 backtest bars, lower timeframe resolution can be about 20 (100000/5000) times lesser than that of regular chart timeframe. We need to also keep in mind that minimum resolution available as part of security_lower_tf is 1 minute. Hence, it is not advisable to use this script for chart timeframes less than 15 mins.
Application
I have been facing this issue in pattern recognition scripts where patterns are formed using high/low prices but entry and targets are calculated based on the opposite side (low/high). It becomes tricky during extreme bars to identify entry conditions based on just the opposite peak because, the candle might have originated from it before identifying the pattern and might have never reached same peak after forming the pattern. Due to lack of tick data on historical bars, we cannot use close price to measure such conditions. This leads to repaint and few unexpected results. I am intending to use this method to overcome the issue up-to some extent.
Relative Bandwidth FilterThis is a very simple script which can be used as measure to define your trading zones based on volatility.
Concept
This script tries to identify the area of low and high volatility based on comparison between Bandwidth of higher length and ATR of lower length.
Relative Bandwidth = Bandwidth / ATR
Bandwidth can be based on either Bollinger Band, Keltner Channel or Donchian Channel. Length of the bandwidth need to be ideally higher.
ATR is calculated using built in ATR method and ATR length need to be ideally lower than that used for calculating Bandwidth.
Once we got Relative Bandwidth, the next step is to apply Bollinger Band on this to measure how relatively high/low this value is.
Overall - If relative bandwidth is higher, then volatility is comparatively low. If relative bandwidth is lower, then volatility is comparatively high.
Usage
This can be used with your own strategy to filter out your non-trading zones based on volatility. Script plots a variable called "Signal" - which is not shown on chart pane. But, it is available in the data window. This can be used in another script as external input and apply logic.
Signal values can be
1 : Allow only Long
-1 : Allow only short
0 : Do not allow any trades
2 : Allow both Long and Short

drawcandlesLibrary "drawcandles"
simple utility to draw different candles using box and lines. Quite useful for drawing candles such as zigzag candles or MTF candles
draw(o, h, l, c, oBar, cBar)
draws candles based on ohlc values
Parameters:
o : Open Price
h : High Price
l : Low Price
c : Close Price
oBar : Open Time
cBar : Close Time
Returns: void
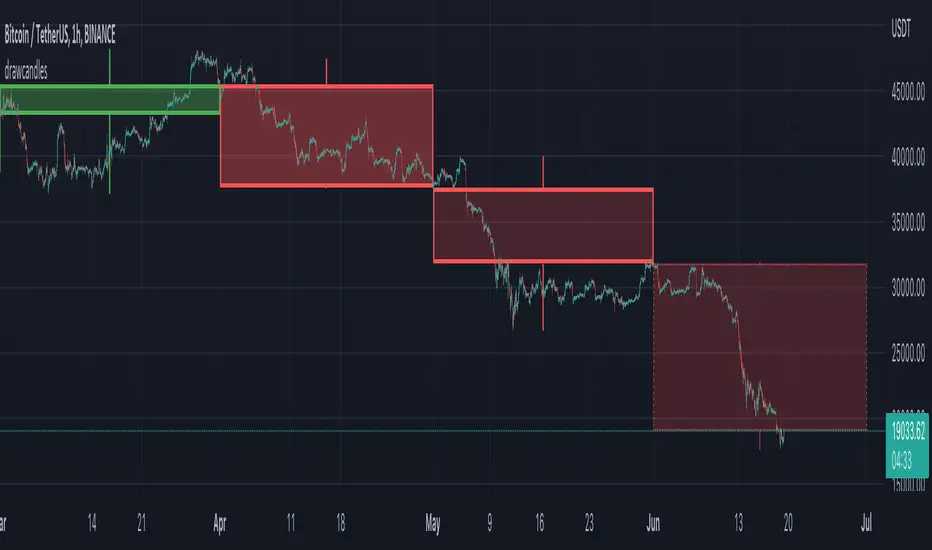
Recursive ZigzagDO NOT USE THIS FOR TRADING. I am just showing off my new found recipe for pattern recognition ;)
This script generates recursive zigzags till there are only 2 pivots. So, the logic goes like this.
Level1 - Standard zigzag calculated from user input of length and max pivots using OHLC values
Level2 - Multi level zigzag calculated on the basis of level1 pivots.
Level3 - Multi level zigzag calculated on the basis of level2 pivots
..
..
..
Level(n) - Multi level zigzag calculated on the basis of level(n-1) pivots and number of derived pivots is 3 or less.
Ability to generate multi level zigzags were explored earlier in many scripts. But, they were just single level up from base and not fully recursive as this. This can be powerful piece of code for pattern recognition algorithms - will be exploring how useful these are going forward.

arraysLibrary "arrays"
Library contains utility functions using arrays.
delete( arr , index)
remove an item from array at specific index. Also deletes the item
Parameters:
arr: - array from which the item needs to be deleted
index: - index of item to be deleted
Returns: void
pop( arr )
remove the last item from array. Also deletes the item
Parameters:
arr: - array from which the last item needs to be removed and deleted
Returns: void
shift( arr )
remove an item from array at index 0. Also deletes the item
Parameters:
arr: - array from which the first item needs to be removed and deleted
Returns: void
unshift( arr , val, maxItems)
add an item to the beginning of an array with max items cap
Parameters:
arr: - array to which the item needs to be added at the beginning
val: - value of item which needs to be added
maxItems: - max items array can hold. After that, items are removed from the other end
Returns: resulting array
clear( arr )
remove and delete all items in an array
Parameters:
arr: - array which needs to be cleared
Returns: void
push( arr , val, maxItems)
add an item to the end of an array with max items cap
Parameters:
arr: - array to which the item needs to be added at the beginning
val: - value of item which needs to be added
maxItems: - max items array can hold. After that, items are removed from the starting index
Returns: resulting array

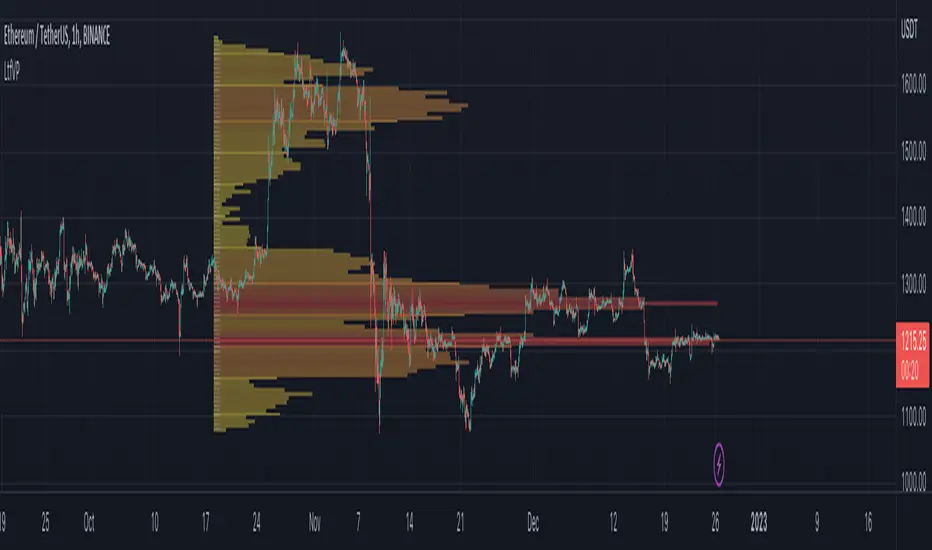
Interactive Volume Profile - Based on LTF volumeHere is my first attempt on defining volume profile. In this script, I am using new feature of pine security_lower_tf
Upon loading the script, it will ask users to select Time range to show the volume profile. Once you select the time range, confirmation input will popup. Upon confirming the inputs, you will be able to view the volume profile
Settings are pretty simple. Some of them appear as part of confirmation.
Limitation due to availability of LTF bars
security_lower_tf can only fetch upto 100k bars, Hence, if we move the starting point beyond that, we will only see volume profile from the bar where LTF volume data is available. Increasing lower timeframe resolution will also increase the available range of volume profile. Option also available to use max range instead of time based range. If max bar range is selected, then volume profile is drawn based on all the bars for which LTF volume is available.
An example of all combinations are show below.
Selecting the granularity of volume profile
Number of levels can be set from settings which impacts the granularity of volume profile. Below is the example of how different values for number of levels behave.
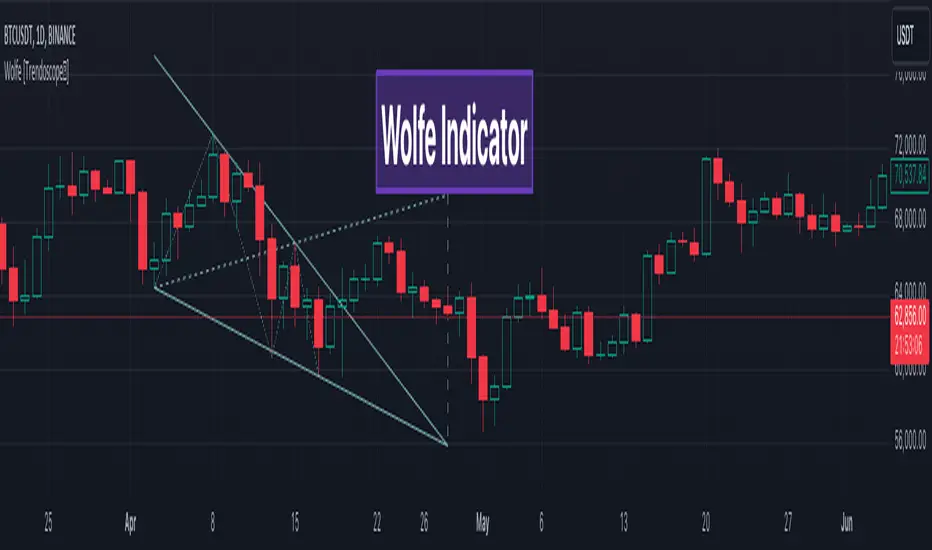
Wolfe Scanner (Multi - zigzag) [HeWhoMustNotBeNamed]Before getting into the script, I would like to explain bit of history around this project. Wolfe was in the back of my mind for some time and I had several attempts so far.
🎯Initial Attempt
When I first developed harmonic patterns, I got many requests from users to develop script to automatically detect Wolfe formation. I thought it would be easy and started boasting everywhere that I am going to attempt this next. However I miserably failed that time and started realising it is not as simple as I thought it would be. I started with Wolfe in mind. But, ran into issues with loops. Soon figured out that finding and drawing wedge is more trickier. I decided will explore trendline first so that it can help find wedge better. Soon, the project turned into something else and resulted in Auto-TrendLines-HeWhoMustNotBeNamed and Wolfe left forgotten.
🎯Using predefined ratios
Wolfe also has predefined fib ratios which we can use to calculate the formation. But, upon initial development, it did not convince me that it matches visual inspection of Wolfe all the time. Hence, I decided to fall back on finding wedge first.
🎯 Further exploration in finding wedge
This attempt was not too bad. I did not try to jump into Wolfe and nor I bragged anywhere about attempting anything of this sort. My target this time was to find how to derive wedge. I knew then that if I manage to calculate wedge in efficient way, it can help further in finding Wolfe. While doing that, ended up deriving Wedge-and-Flag-Finder-Multi-zigzag - which is not a bad outcome. I got few reminders on Wolfe after this both in comments and in PM.
🎯You never fail until you stop trying!!
After 2 back to back hectic 50hr work weeks + other commitments, I thought I will spend some time on this. Took less than half weekend and here we are. I was surprised how much little time it took in this attempt. But, the plan was running in my subconscious for several weeks or even months. Last two days were just putting these plans into an action.
Now, let's discuss about the script.
🎲 Wolfe Concept
Wolfe concept is simple. Whenever a wedge is formed, draw a line joining pivot 1 and 4 as shown in the chart below:
Converging trendline forms the stop loss whereas line joining pivots 1 and 4 form the profit taking points.
🎲 Settings
Settings are pretty straightforward. Explained in the chart below.
Auto Harmonic Pattern - UltimateX [Trendoscope]IMPORTANT NOTE: (Read this before looking at any other thing on this indicator)
This indicator is created to supersede existing Auto-Harmonic-Pattern-Ultimate-Trendoscope invite only script. The script deviates a lot from the original Auto Harmonic Patterns Ultimate script in terms of number of available patterns, trading type and few other things. Hence, instead of updating the existing script, we have just decided to release as new script. Few FAQs in this regard are as below
What it means for users of AHPU and new users?
▶ Subscription of this script is not sold separately, but will be offered along with existing AHPU script. Meaning, there will be single subscription for both scripts together.
▶ All existing subscribers of AHPU will also get access to this script for the duration of their subscription term. Will start adding access to users starting from lifetime subscribers first.
▶ Any new subscriptions to AHPU will also get access to both the scripts together. We will eventually look to phase out existing AHPU once users are accustomed to new script and any possible bugs are resolved.
▶ Any trial requests will also get access to both scripts. You can request trial even if you have recently requested trial for AHPU.
Why did we create new script instead of updating the existing one?
▶ As mentioned before, this script deviates a lot from the original AHPU. Hence, it is released as new version to make sure smoother transition of users. If anyone is not comfortable using the new version, they can continue using the existing AHPU script until things settle down.
▶ Since the script is new implementation, it may also have initial bugs. It will help us resolve it in more streamlined way.
What are the main differences between these scripts?
▶ Uses single zigzag instead of multi as algorithm is further improved to detect almost everything using single zigzag.
▶ More number of patterns added. But, new patterns are disabled by default as some of them have very wide PRZ. Users can enable it via settings.
▶ Trading type with trailing entry - With wide PRZs, we also had to implement different method for calculating entry/stop. This is explained later in the script.
▶ Matrix implementation and enhanced stats - Entire implementation is redesigned to use matrix data structure instead of arrays. This allows lots of possibilities including enhanced closed trade stats.
▶ Support/Resistance widget is removed as it is proving to be bit of overhead. Users can make use of Support Resistance widget script which is a free to use script instead.
Let's get to the details of indicator now.
🎲 Indicator Components
🎯 Patterns Covered
● Classic Patterns
Gartley
Bat
Butterfly
Crab
Deep Crab
Cypher
Shark
Nenstar
● Anti/Alternate Patterns
Anti Nenstar
Anti Shark
Anti Cypher
Anti Crab
Anti Butterfly
Anti Bat
Anti Gartley
Navarro200
● Non-Standard Patterns (Disabled by default)
Five Zero
Three Drives
White Swan
Black Swan
Sea Pony
Leonardo
121
Snorm
Total
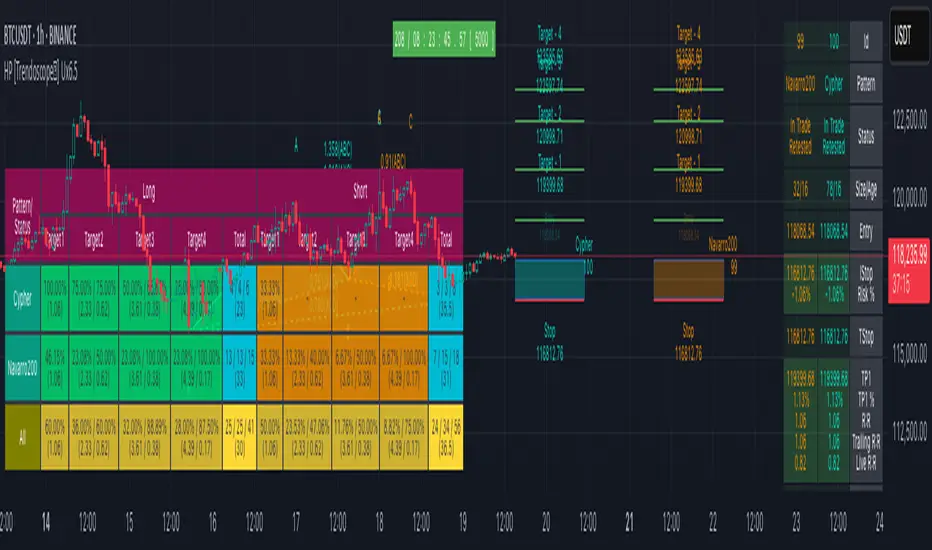
Below is a quick snapshot of indicator components.
Now, lets look at some of the individual components:
🎯 Open trade stats helps recognise trades in motion.
Apart from regular stats, it also contain different types of risk reward ratios.
Regular RR : RR calculated from entry to reach target with initial stop for risk consideration
Trailing RR : This is RR calculated for price to reach from one target to next target considering trailing stop for calculating risk
Live RR : This is calculated based on current price as entry and with given targets and stop levels. Live RR will be blank for targets which are already reached.
Targets are calculated only when entry is made. Hence, target details are not shown for patterns where it is still awaiting entry.
🎯 Closed trade stats helps understand historical performance of patterns.
By default closed stats are displayed in Compact mode. Which means, only total stats are shown. But, users can change this to show detailed stats via settings. Detailed stats take up entire screen most of the time. So, keep them only if it is required.
Closed stats present average Risk Reward, Trailing Risk Reward, Average Win Rate, and Average Trailing Win Rate for all the possible levels. As discussed before.
Regular RR : RR calculated from entry to reach target with initial stop for risk consideration
Trailing RR : This is RR calculated for price to reach from one target to next target considering trailing stop for calculating risk
Win Rate : Simple win rate calculation based on number of patterns reached target and number of valid patterns.
Trailing Win Rate : This is win rate calculated based on previous target to current target.
For example, if there are 48 valid patterns and out of which 24 patterns reach target1 and 12 patterns out of 24 reach target 2
Target1 WR : 50% (24/48)
Target1 TWR : Not applicable as there is no target before Target1
Target2 WR : 25% (12/48)
Target2 TWR : 50% (12/24)
🎲 Settings
Tooltips are provided to help with each and every settings. And they are as below.
🎲 Fully Customisable Alerts - Placeholders
Alerts are created via alert() method of pine. Hence, users will not see message box for alert template on alert widget.
Instead alerts widget look something like this:
To overcome this issue, script provides alert template placeholders as part of settings. In settings, you can already see Alert section where you can enable/disable alerts for different events.
▶ New Pattern Detection
▶ Entry Reached
▶ Target1-4 Reached
▶ Stop price reached
▶ Trade Complete - either by stop or reaching target 4
You can use following placeholders in the given text boxes to create your own alert template.
🎯 Common placeholders which are applicable for all alerts
{type} - Alert Type
- New Harmonic Pattern
- Harmonic Pattern Status Update
- Harmonic Pattern Trade Closure
{id} - Pattern Id. This is not fully unique id. But, this will be unique for all open trades. Once trade is closed, Ids are reused whenever feasible.
{ticker} - Ticker information
{timeframe} - Timeframe information
{price} - Current close price
{patterns} - Possible patterns for the projections or PRZ.
{direction} - Trade direction - Bullish or bearish
{entry} - Calculated entry for pattern
{stop} - Calculated stop for pattern
{tstop} - Trailing stop for the pattern in trade
{target1} - Target1 for pattern in trade
{target2} - Target2 for pattern in trade
{target3} - Target3 for pattern in trade
{target4} - Target4 for pattern in trade
🎯 There are few specific placeholders, which are applicable for some alert types.
Harmonic Pattern Status Update
{status} - Status of the Pattern in trade
{laststatus} - Previous status of the Pattern in trade
Harmonic Pattern Trade Closure
{result} - Trade result upon closure
有料スクリプト
Auto Chart Patterns - Ultimate [Trendoscope]Here is an attempt to gather and present stats and probabilities of different chart patterns. Here, we challenge few traditional biases such as rising wedge is bearish, falling wedge is bullish etc. All the chart patterns identified in this script are bi-directional. Meaning they offer opportunities to trade in either direction.
This indicator is built on the base of two free scripts
🎯 Wedge-and-Flag-Finder-Multi-zigzag
🎯 Trendline-Pairs-Deep-Search
🎲 Following are the major highlights/updates in the present script
▶ Uses the similar deep search algorithm for finding patterns. Pattern identification logic has been optimised to provide more accurate patterns.
▶ Provides suggestion on how to trade these patterns - along with entry, stop and target suggestions.
▶ Advanced options available in setting such as 'Safe Repaint' - which enables repaint only when trade has not started.
▶ Option to run algorithm within specified time window
▶ Comprehensive stats on historical patterns which include win ratio, risk reward, trailing win ratio and trailing risk reward.
▶ Open Trades Stats widget which can help tracking trades easily.
▶ Fully customisable alerts - which can be used to plugin into bots.
🎲 Chart Patterns Included
▶ Channel - Uptrend, Downtrend, Ranging
▶ Triangle - Expanding, Contracting
▶ Rising Wedge - Expanding, Contracting
▶ Falling Wedge - Expanding, Contracting
If unable to determine the type and yet pivots are inline to form two trend lines, then it goes to category - Indeterminate
🎲 Indicator Components
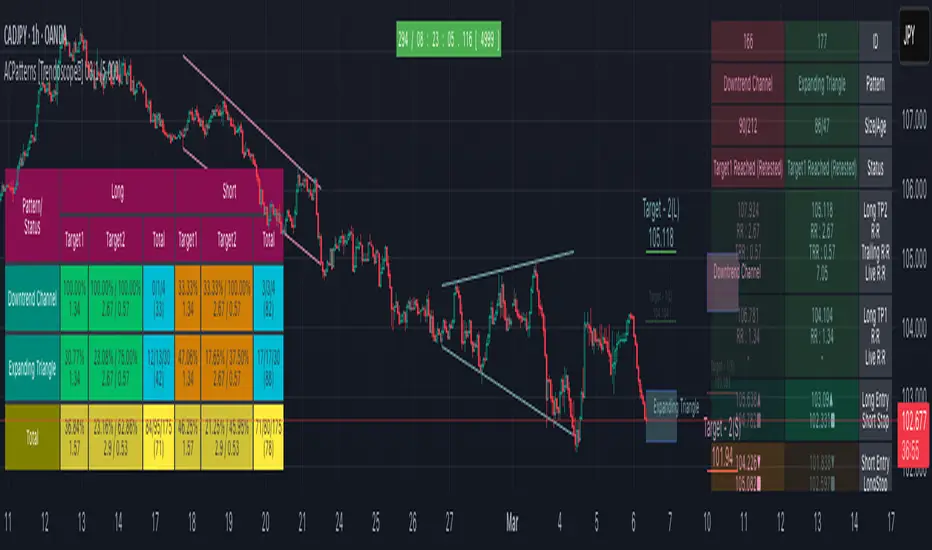
Below is a quick snapshot of indicator components.
Now, lets look at some of the individual components:
▶Open trade stats helps recognise trades in motion.
▶ Closed trade stats can either be shown with minimal stats or fully detailed stats.
🎲 Settings
▶ Generic Settings
▶ Zigzag and pattern selection
▶ Channel Settings
▶ Risk/Reward and Stats/Display Settings
🎲 Key Features
⬤ Safe Repaint :
This option allows redrawing pattern only if trade has not been taken. This increases accuracy of pattern detection. Example of impact of safe repaint is shows as below:
⬤ Trade Reversal or Breakout of Channels :
This option is useful to handle channels of different size. If the distance between channel trendlines are huge, then it is more advantageous to trade reversals. If the distance between trendlines of channel is small, it is more rewarding to trade the breakouts.
Here is an example of how this setting impacts the trade suggestions.
⬤ Detailed Closed Trade Stats :
Closed Stats settings give users option to see in depth details such as risk reward and win ratios for past patterns along with numbers.
⬤ Fully Customisable Alerts :
Alerts are implemented using alert method. Hence, users will not see text box in alert window where they can set alert format. To overcome this challenge, the indicator offers customisation of alerts through settings.
In the settings window, you notice below options for alerts
These settings allow users to enable/disable alerts for different status of patterns. The text box in the settings allows users to set customisable alert formats using specific placeholders.
Valid placeholders are:
{type} - Alert Type
{id} - Pattern id for which alert is generated
{ticker} - Ticker for which alert is generated
{timeframe} - Chart timeframe
{price} - Current close price
{pattern} - Name of the pattern
{longTrade} - Array containing stop, entry, target1 and target2 for long side of the trade for given pattern
{shortTrade} - Array containing stop, entry, target1 and target2 for short side of the trade for given pattern
{status} - Contains status of both long and short side of the trades as text
Default alert template set for all type of alerts is as below
{
"alert" : "{type}",
"id" : {id},
"ticker" : "{ticker}",
"timeframe" : "{timeframe}",
"price" : {price},
"pattern" : "{pattern}",
"long " : {longTrade},
"short " : {shortTrade},
"status" : "{status}"
}
An example alert looks like this:
If you just want to display pattern name and alert type, your alert message in the box should be something like this:
Type - {type}, Pattern - {pattern}
Will make a video on settings and usage when I get time :)
有料スクリプト
Zigzag MatrixNothing fancy. Just converted the new matrix library of zigzags ( mZigzag ) into indicator as I sensed it can be useful as indicator.
On top of the standard zigzag, the indicator also tracks given oscillators, moving average and volume indicators on each pivots. More indicators can be added programmatically - but it will take up space in chart. Hence, so far I have only added option to add one per each type (moving average, oscillator and volume)
Settings are as below

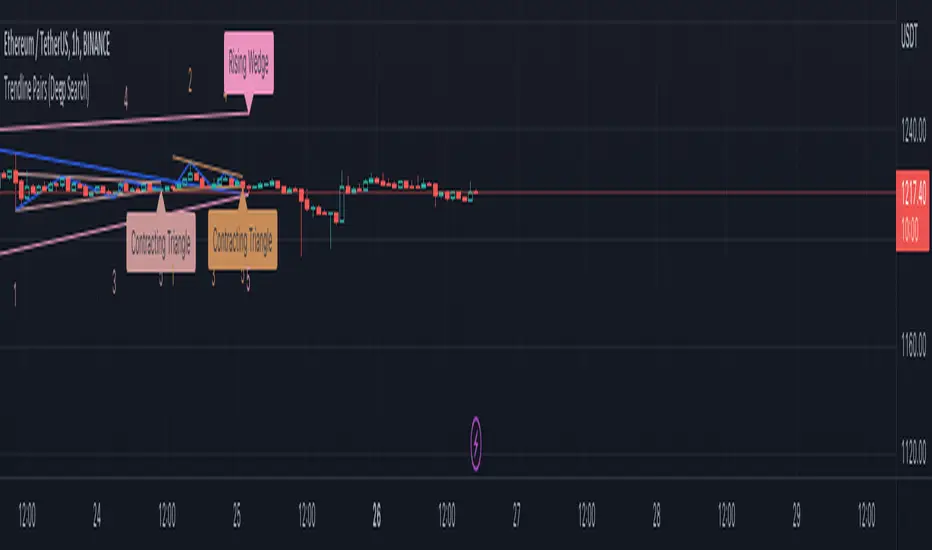
Trendline Pairs (Deep Search)After getting good response on Wedge-and-Flag-Finder-Multi-zigzag , I thought I will build little bit further into the script.
Main differences
Uses deep search algorithm for patterns instead of just using last 5 pivots
Flag pattern is removed so that we can concentrate mainly on trend line pairs
More number of overall patterns.
Trend Patterns Included
Channel - Rising, Falling, Ranging
Wedge - Rising, Falling + Expanding, Contracting types
Triangle - Expanding, Contracting
Indeterminate - Happens in rare cases where angle calculation results in error. It may still belong to one of the above patterns.
Please note:
This is published as free to use but protected source code indicator. This is because the script contains deep search algorithm which isn't made public yet and is also been used in other invite only scripts.
Will not be adding alerts to this indicator.
mZigzagLibrary "mZigzag"
Matrix implementation of zigzag to allow further possibilities.
Main advantage of this library over previous zigzag methods is that you can attach any number of indicator/oscillator information to zigzag
calculate(length, ohlc, indicatorHigh, indicatorLow, numberOfPivots) calculates zigzag and related information
Parameters:
length : is zigzag length
ohlc : array of OHLC values to be used for zigzag calculation
indicatorHigh : Array of indicator values calculated based on high price of OHLC
indicatorLow : Array of indicators values calculated based on low price of OHLC
numberOfPivots : Number of pivots to be returned
Returns: pivotMatrix Matrix containing zigzag pivots, pivot bars, direction, ratio, and indicators added via indicatorHigh/indicatorLow
newZG is true if a new pivot is added to array
doubleZG is true if last calculation returned two new pivots (Happens on extreme price change)
draw(length, ohlc, indicatorLabels, indicatorHigh, indicatorLow, numberOfPivots, lineColor, lineWidth, lineStyle, showHighLow, showRatios, showIndicators) draws zigzag and related information
Parameters:
length : is zigzag length
ohlc : array of OHLC values to be used for zigzag calculation
indicatorLabels : Array of name of indicators passed
indicatorHigh : Array of indicator values calculated based on high price of OHLC
indicatorLow : Array of indicators values calculated based on low price of OHLC
numberOfPivots : Number of pivots to be returned
lineColor : zigzag line color. set to blue by default
lineWidth : zigzag line width. set to 1 by default
lineStyle : zigzag line style. set to line.style_solid by default
showHighLow : show HH, HL, LH, LL labels
showRatios : show pivot retracement ratios from previous zigzag
showIndicators : show indicator values
Returns: pivotMatrix Matrix containing zigzag pivots, pivot bars, direction, ratio, and indicators added via indicatorHigh/indicatorLow
zigzaglines array of zigzag lines
zigzaglabels array of zigzag labels