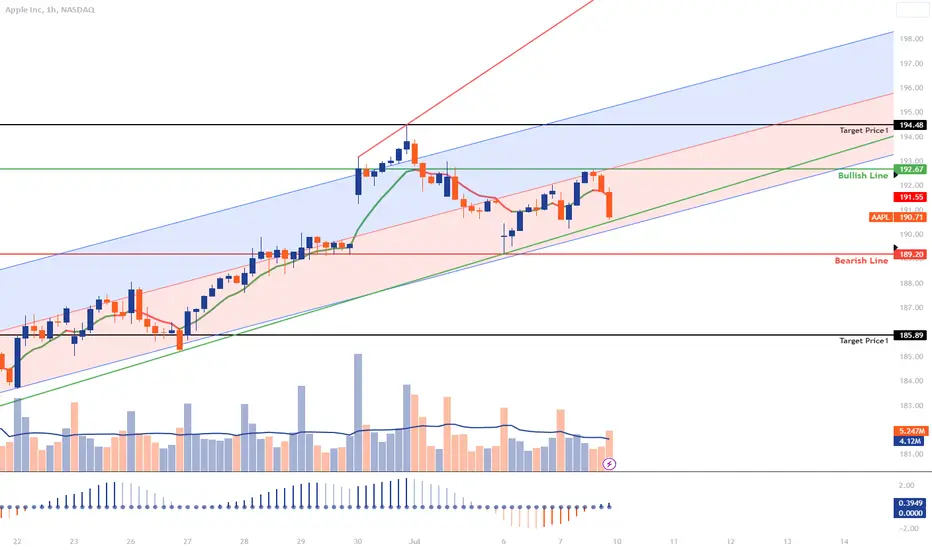
Technical Analysis for AAPL:
If AAPL breaks above the bullish line of $192.67, it may indicate a bullish signal, suggesting potential upward price movement. In this scenario, the first target price (TP1) could be set at $194.48.
Conversely, if AAPL breaks below the bearish line of $189.20, it may suggest a bearish signal, implying potential downward price movement. In this case, the first target price (TP1) could be set at $185.89.
関連の投稿
免責事項
この情報および投稿は、TradingViewが提供または推奨する金融、投資、トレード、その他のアドバイスや推奨を意図するものではなく、それらを構成するものでもありません。詳細は利用規約をご覧ください。
免責事項
この情報および投稿は、TradingViewが提供または推奨する金融、投資、トレード、その他のアドバイスや推奨を意図するものではなく、それらを構成するものでもありません。詳細は利用規約をご覧ください。