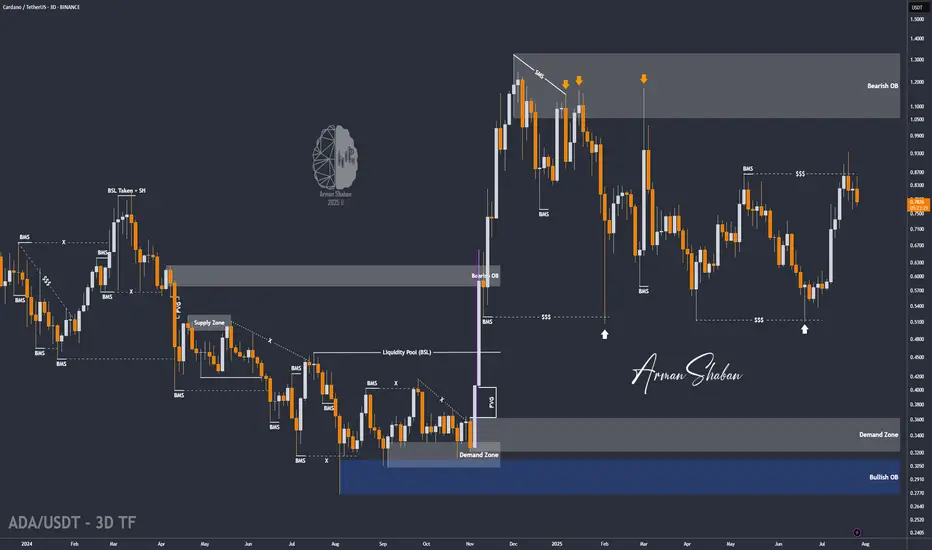
By analyzing the Cardano chart on the 3-day timeframe, we can see that after reaching $0.935, the price faced selling pressure and dropped by 18% to the $0.76 area. Now, the key is whether ADA can hold above the $0.75 level by the end of the week. If it succeeds, we could expect further bullish continuation. The next potential targets are $0.86, $0.93, $1.02, and $1.32.
Please support me with your likes and comments to motivate me to share more analysis with you and share your opinion about the possible trend of this chart with me !
Best Regards , Arman Shaban
Please support me with your likes and comments to motivate me to share more analysis with you and share your opinion about the possible trend of this chart with me !
Best Regards , Arman Shaban
⚜️ Free TG Channel : t.me/PriceAction_ICT
⚜️ Contact for VIP : t.me/ArmanShabanTrading
🎉 The Best Crypto Exchange ($100 Bonus) : lbank.com/ref/4Y77P
✅ One of the Best Forex Brokers (Lirunex) : bit.ly/4oCawfH
⚜️ Contact for VIP : t.me/ArmanShabanTrading
🎉 The Best Crypto Exchange ($100 Bonus) : lbank.com/ref/4Y77P
✅ One of the Best Forex Brokers (Lirunex) : bit.ly/4oCawfH
関連の投稿
免責事項
これらの情報および投稿は、TradingViewが提供または保証する金融、投資、取引、またはその他の種類のアドバイスや推奨を意図したものではなく、またそのようなものでもありません。詳しくは利用規約をご覧ください。