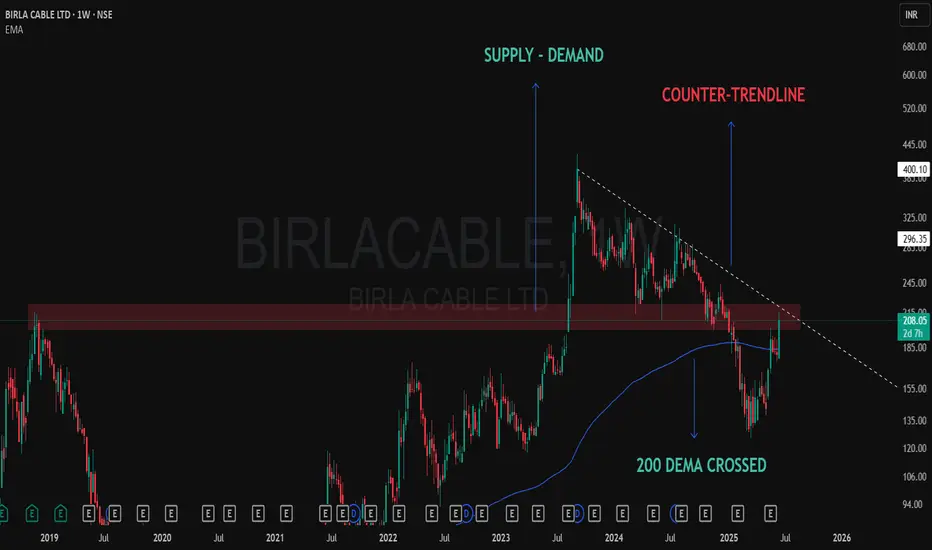
📈 BIRLA CABLE – Chart Talking Loud Now!
✅ 200 DEMA crossed
200 Dema was providing solid resistance and now taken out marked with blue line.
❌ At Counter-Trendline
Solid CT thrown from the top of the pattern, dotted white line shows that.
✅ Demand Zone Holding Strong
Clearly shown a solid supply zone which got converted into a Demand only after the Breakout some months back.
After months of consolidation and rejection from the same supply zone… price is now attacking with volume 🔥
🧠 “When structure aligns with emotionless patience, conviction follows.”
🎯 Master My Self-Made Trading Strategy
📈 Telegram (Learn Today): t.me/hashtaghammer
✅ WhatsApp (Learn Today): wa.me/919455664601
📈 Telegram (Learn Today): t.me/hashtaghammer
✅ WhatsApp (Learn Today): wa.me/919455664601
関連の投稿
免責事項
この情報および投稿は、TradingViewが提供または推奨する金融、投資、トレード、その他のアドバイスや推奨を意図するものではなく、それらを構成するものでもありません。詳細は利用規約をご覧ください。