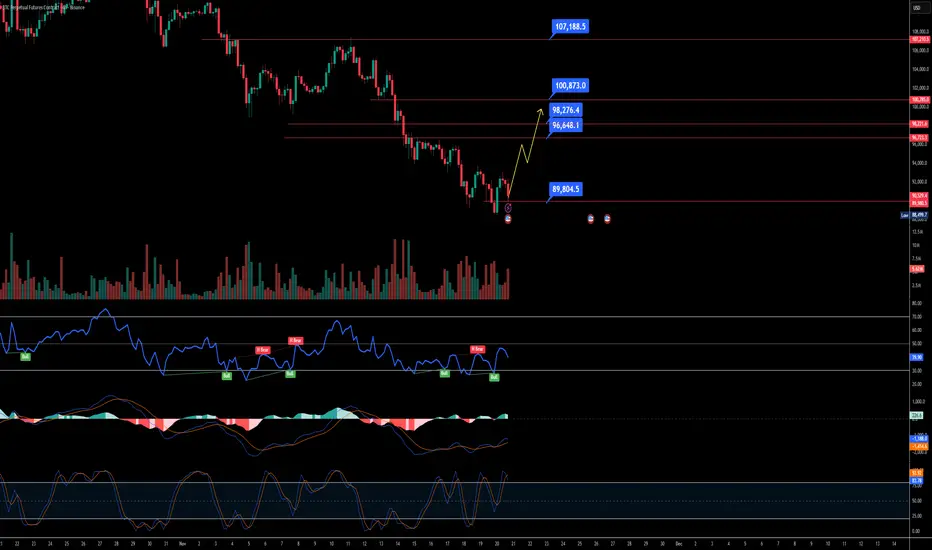
Right now on the 4-hour chart, BTC is clearly building a strong bullish pattern.
🔹 Price action is forming a clean Inverse Head & Shoulders structure.
🔹 RSI is showing a bullish divergence, meaning momentum is strengthening while price is stabilising.
🔹 This setup usually indicates a breakout move once the neckline is breached.
If BTC starts rising from the current zone, the market is likely to grab liquidity near the $97,000 level, which is the next major area where stop-loss clusters and pending orders are sitting.
In simple terms:
BTC looks ready for a bullish expansion — liquidity target: ~$97,000.
FOLLOW MY TELEGRAM CHANNEL FOR FREE : bit.ly/3JfrpgV
免責事項
この情報および投稿は、TradingViewが提供または推奨する金融、投資、トレード、その他のアドバイスや推奨を意図するものではなく、それらを構成するものでもありません。詳細は利用規約をご覧ください。
FOLLOW MY TELEGRAM CHANNEL FOR FREE : bit.ly/3JfrpgV
免責事項
この情報および投稿は、TradingViewが提供または推奨する金融、投資、トレード、その他のアドバイスや推奨を意図するものではなく、それらを構成するものでもありません。詳細は利用規約をご覧ください。