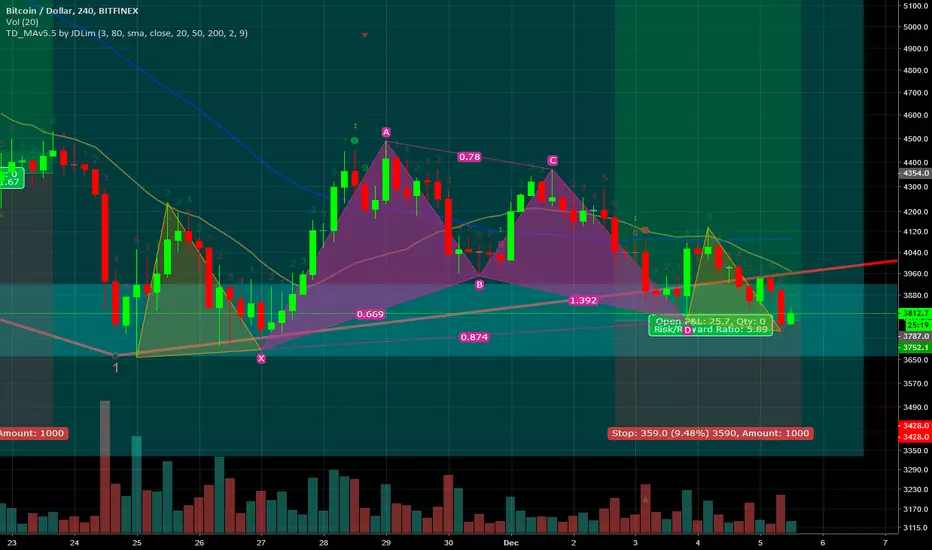
The 4 hour chart shows a symmetrical pattern of triangles which usually means the congestion pattern is nearing the end of its life and a breakout is coming soon.
It could go either way, I am hoping it's up but if it turns out to be down I am going to be looking get out of my long and start looking at shorts.
The 4 hour TD sequential count is almost to 9 and is on a red count which means it could definitely break upward very strongly from here.
It could go either way, I am hoping it's up but if it turns out to be down I am going to be looking get out of my long and start looking at shorts.
The 4 hour TD sequential count is almost to 9 and is on a red count which means it could definitely break upward very strongly from here.
関連の投稿
免責事項
これらの情報および投稿は、TradingViewが提供または保証する金融、投資、取引、またはその他の種類のアドバイスや推奨を意図したものではなく、またそのようなものでもありません。詳しくは利用規約をご覧ください。
免責事項
これらの情報および投稿は、TradingViewが提供または保証する金融、投資、取引、またはその他の種類のアドバイスや推奨を意図したものではなく、またそのようなものでもありません。詳しくは利用規約をご覧ください。