Hello everyone !
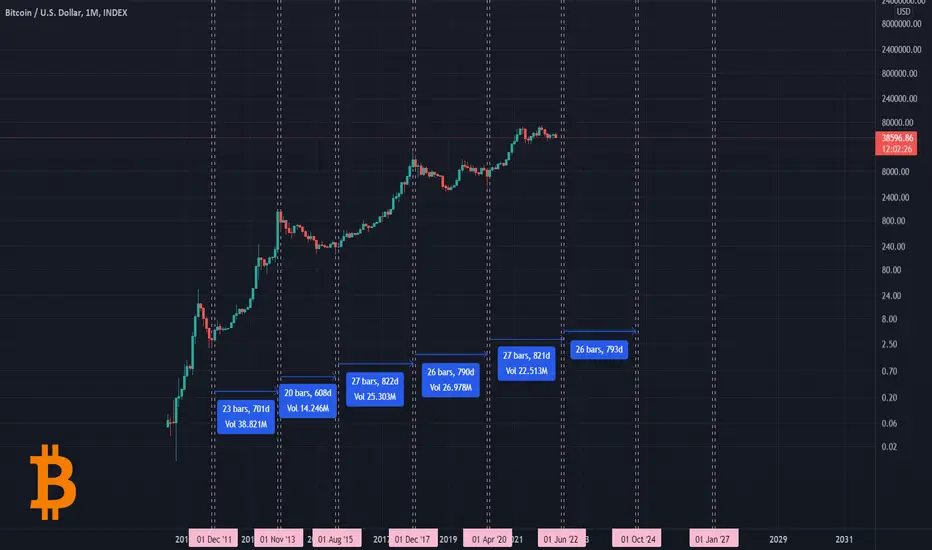
With this chart you can always know when the exact time for BTC and the whole crypto market to turn Bullish or Bearish in this repetitive cycle.
Each part consists of two lines, the first line to indicate the end of the current cycle and the second line to indicate the beginning of the new cycle.
The average is 748 Days for all cycles, And as you can see in terms of time market is too close to turn, So be aware of Bears!
----------------------------------------------------------------
Liked the idea?
Comment, Like, Follow ✌
免責事項
これらの情報および投稿は、TradingViewが提供または保証する金融、投資、取引、またはその他の種類のアドバイスや推奨を意図したものではなく、またそのようなものでもありません。詳しくは利用規約をご覧ください。
免責事項
これらの情報および投稿は、TradingViewが提供または保証する金融、投資、取引、またはその他の種類のアドバイスや推奨を意図したものではなく、またそのようなものでもありません。詳しくは利用規約をご覧ください。