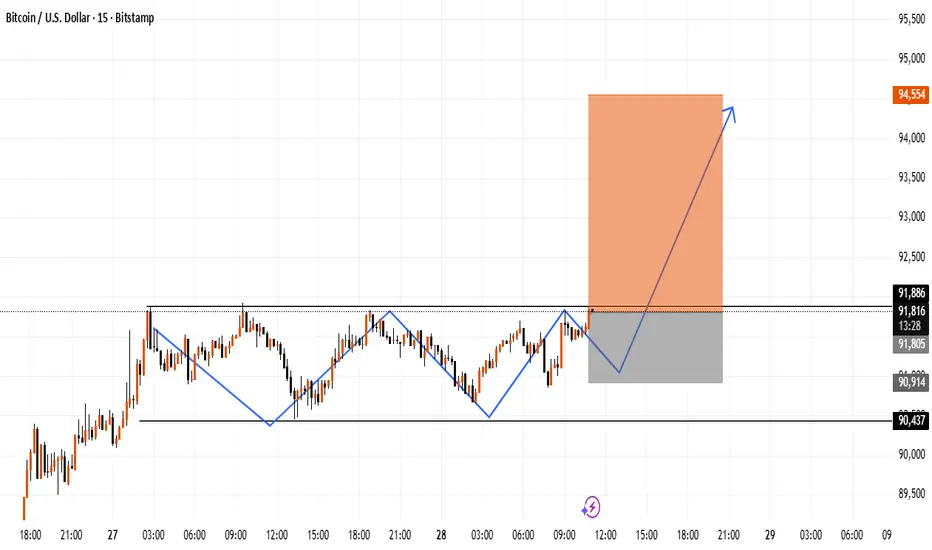
This chart highlights a short-term range on BTC where price has been reacting around the same horizontal zone multiple times. A clear internal structure shift can be seen, followed by a deeper pullback into the recent demand area. If price maintains support above this zone, it may open room for an upside continuation toward the next liquidity level.
The marked move is a possible price scenario, not a certainty.
This idea is shared for market observation and educational analysis only.
The marked move is a possible price scenario, not a certainty.
This idea is shared for market observation and educational analysis only.
トレード稼働中
active time免責事項
この情報および投稿は、TradingViewが提供または推奨する金融、投資、トレード、その他のアドバイスや推奨を意図するものではなく、それらを構成するものでもありません。詳細は利用規約をご覧ください。
免責事項
この情報および投稿は、TradingViewが提供または推奨する金融、投資、トレード、その他のアドバイスや推奨を意図するものではなく、それらを構成するものでもありません。詳細は利用規約をご覧ください。