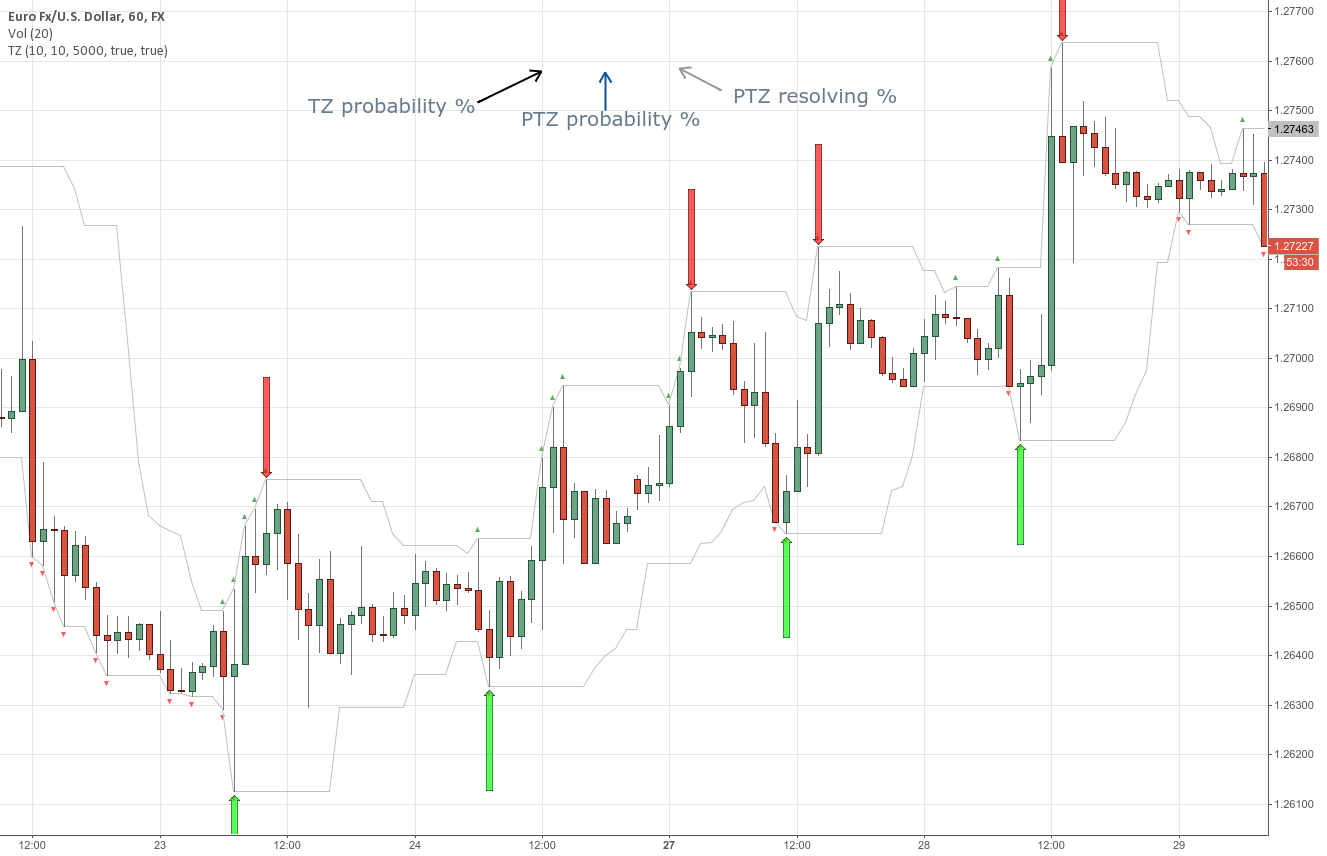
The TZ method is fairly easy. There is several tradingview scripts for Transient Zones.
You can almost grasp it by looking at the rectangles on the chart that makes up the method. It's a support and resistance system with a time factor based on the chart geometry.

www.forexfactor.../showthread.php?t=434603&a...
www.forexfactor.../showthread.php?t=434603
docplayer.net/473896...z-clues-lessons.html
These resources (not that of my own) go over the strategy in detail.
Here I've applied the strategy to bitcoin on the 15 min time frame... some boxes represent zones on larger time-frames.
I've used lines at large zones/upper TF zones instead of the exact method.
You can almost grasp it by looking at the rectangles on the chart that makes up the method. It's a support and resistance system with a time factor based on the chart geometry.
www.forexfactor.../showthread.php?t=434603
docplayer.net/473896...z-clues-lessons.html
These resources (not that of my own) go over the strategy in detail.
Here I've applied the strategy to bitcoin on the 15 min time frame... some boxes represent zones on larger time-frames.
I've used lines at large zones/upper TF zones instead of the exact method.
コメント:
コメント:
コメント:
コメント:
コメント:
コメント:
So we can break down now, or head up for several hours and retest 7400-7650 range.
that is all for now.
that is all for now.
コメント:
コメント:
コメント:
コメント:
We break the top of the yellow zone, we go up :).....
コメント:
Sell here, buy the break..... if you were to trade it, I won't.
トレード終了: 利益確定目標に到達:
HAH we broke up already.
コメント:
コメント:
コメント:
コメント:

コメント:
コメント:
So obviously, I combined my indicators and a gannbox with gann fans overlayed on top of the transient zone chart. price follows angles quite well.
コメント:
コメント:
コメント:
コメント:
コメント:
コメント:
コメント:
コメント:
コメント:
コメント:
コメント:
コメント: