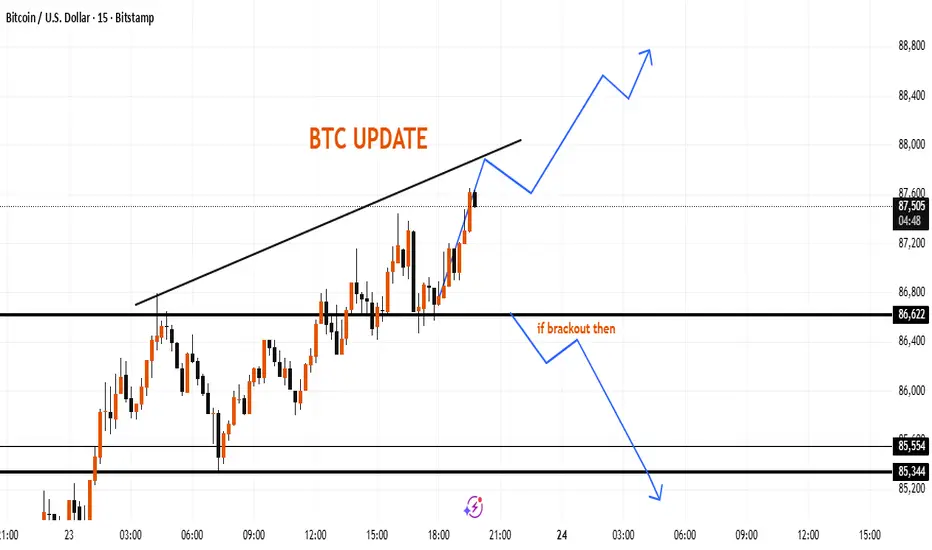
Bitcoin is currently moving within an ascending structure, approaching a trendline that has acted as a reaction zone in recent candles. If price holds above the 87,500 area, the chart suggests the potential for continued upward momentum toward higher intraday levels.
If the market slips below the 86,620 zone, it may indicate a shift toward lower support areas around 85,550–85,340, where the chart previously showed reactions.
This update highlights the key zones to watch based on recent movement and overall short-term structure.
If the market slips below the 86,620 zone, it may indicate a shift toward lower support areas around 85,550–85,340, where the chart previously showed reactions.
This update highlights the key zones to watch based on recent movement and overall short-term structure.
トレード稼働中
its time to trade activeトレード終了: 利益確定目標に到達
say something about btc免責事項
この情報および投稿は、TradingViewが提供または推奨する金融、投資、トレード、その他のアドバイスや推奨を意図するものではなく、それらを構成するものでもありません。詳細は利用規約をご覧ください。
免責事項
この情報および投稿は、TradingViewが提供または推奨する金融、投資、トレード、その他のアドバイスや推奨を意図するものではなく、それらを構成するものでもありません。詳細は利用規約をご覧ください。