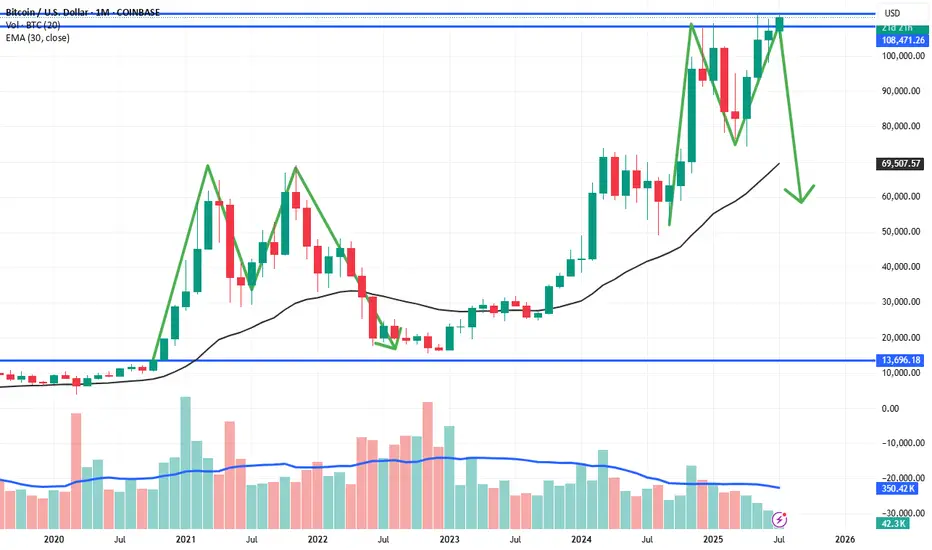
I think Bitcoin Starts becoming Double top or M Pattern in this or next month or it will become new high and then comes to bear zone to 65-75k zone . you can see historical Monthly chart , where M pattern shows clearly , and current scenario looks like same .
免責事項
これらの情報および投稿は、TradingViewが提供または保証する金融、投資、取引、またはその他の種類のアドバイスや推奨を意図したものではなく、またそのようなものでもありません。詳しくは利用規約をご覧ください。
免責事項
これらの情報および投稿は、TradingViewが提供または保証する金融、投資、取引、またはその他の種類のアドバイスや推奨を意図したものではなく、またそのようなものでもありません。詳しくは利用規約をご覧ください。