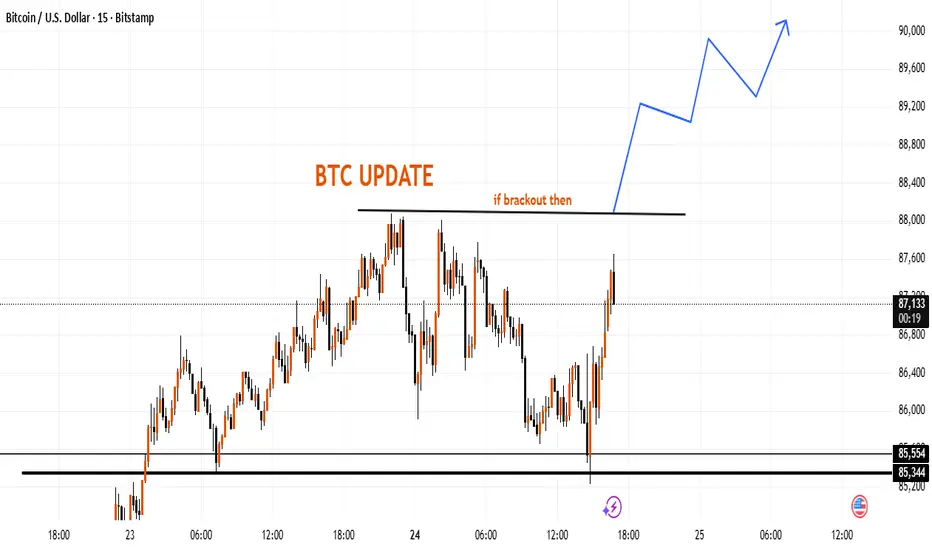
This chart highlights an important resistance zone around the 88,000 area. If price manages to move firmly above this level, the market may continue forming a higher-timeframe structure toward the 89,000–90,000 region.
The lower zone near 85,300–85,550 remains a notable support area where previous reactions occurred.
This outline is based purely on market structure and potential price behavior, not a trading instruction.
The lower zone near 85,300–85,550 remains a notable support area where previous reactions occurred.
This outline is based purely on market structure and potential price behavior, not a trading instruction.
トレード稼働中
its time to trade activeトレード終了: 利益確定目標に到達
target compleate免責事項
この情報および投稿は、TradingViewが提供または推奨する金融、投資、トレード、その他のアドバイスや推奨を意図するものではなく、それらを構成するものでもありません。詳細は利用規約をご覧ください。
免責事項
この情報および投稿は、TradingViewが提供または推奨する金融、投資、トレード、その他のアドバイスや推奨を意図するものではなく、それらを構成するものでもありません。詳細は利用規約をご覧ください。