BTC/USD: Final wave before breakout or correction signal?
📊 Monthly Technical Analysis — Bitcoin (BTC/USD)
Using support/resistance levels and wave analysis
🌀 Wave Context
According to the Elliott Wave Principle model, Bitcoin may be either in the final impulse wave (5) or at the start of an A-B-C corrective structure.
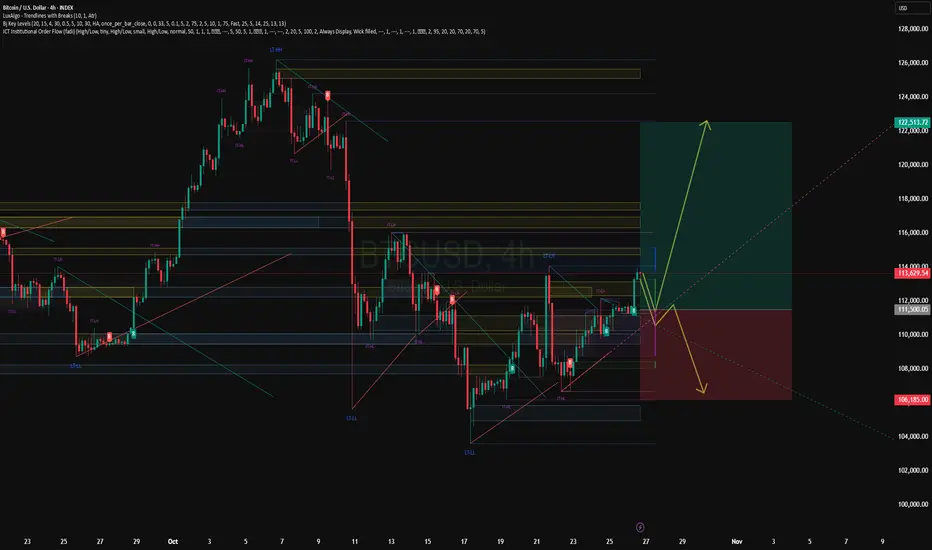
Wave (4) is expected to have ended near the $100,000-$110,000 zone. If wave (5) starts, it could signal a significant upward move. Otherwise, a breakout of support could signal a correction.
📈 Monthly Scenarios
Bullish scenario: BTC holds above $110,000 → breakout to $120,000 → start of wave (5) → move to $135,000+.
Consolidation: The price moves sideways between ~$110,000 and ~$120,000, accumulating strength before a new move.
Bearish scenario: Breakout of support at ~$110,000 with volume → correction to ~$100,000 or lower.
✅Conclusion
On the monthly timeframe, BTC/USD is at a crossroads: it is either entering a powerful uptrend or a significant correction is beginning.
The ~$110,000 level is a key marker for the continuation of the bullish structure.
A breakout above $120,000 is a signal for growth.
A breakout below $110,000 is a signal for caution.
Monitor price movement relative to these levels and confirmation of the wave structure before making trading decisions.
📊 Monthly Technical Analysis — Bitcoin (BTC/USD)
Using support/resistance levels and wave analysis
🌀 Wave Context
According to the Elliott Wave Principle model, Bitcoin may be either in the final impulse wave (5) or at the start of an A-B-C corrective structure.
Wave (4) is expected to have ended near the $100,000-$110,000 zone. If wave (5) starts, it could signal a significant upward move. Otherwise, a breakout of support could signal a correction.
📈 Monthly Scenarios
Bullish scenario: BTC holds above $110,000 → breakout to $120,000 → start of wave (5) → move to $135,000+.
Consolidation: The price moves sideways between ~$110,000 and ~$120,000, accumulating strength before a new move.
Bearish scenario: Breakout of support at ~$110,000 with volume → correction to ~$100,000 or lower.
✅Conclusion
On the monthly timeframe, BTC/USD is at a crossroads: it is either entering a powerful uptrend or a significant correction is beginning.
The ~$110,000 level is a key marker for the continuation of the bullish structure.
A breakout above $120,000 is a signal for growth.
A breakout below $110,000 is a signal for caution.
Monitor price movement relative to these levels and confirmation of the wave structure before making trading decisions.
関連の投稿
免責事項
これらの情報および投稿は、TradingViewが提供または保証する金融、投資、取引、またはその他の種類のアドバイスや推奨を意図したものではなく、またそのようなものでもありません。詳しくは利用規約をご覧ください。
関連の投稿
免責事項
これらの情報および投稿は、TradingViewが提供または保証する金融、投資、取引、またはその他の種類のアドバイスや推奨を意図したものではなく、またそのようなものでもありません。詳しくは利用規約をご覧ください。