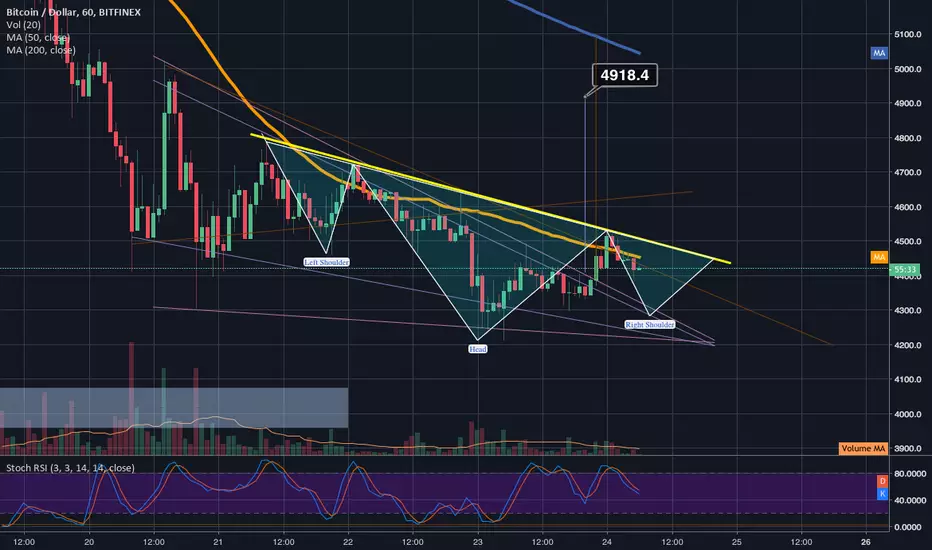
We are now potentially forming an inverted head and shoulder pattern overlaid on top of the falling wedge which only will increase the odds of a bullish breakout for btc. In order for this inverted head and shoulders to have a chance it must have a bounce before too long and the most likely spot we have as a good bounce support is the top trendline of the falling wedge...if we see it stay above that line odds are good of validating both he breakout of the falling wedge and the inverted h&s pattern but until I see that, this idea will remain neutral for now....if I see it break under the falling wedge trendline I will lean more bearish and think this was nothing more than a dead cat fakeout bounce...but for now we will have to wait and see what it decides to do at the falling wedge top trendline. I may not sell again until it breaks under the bottom trendline of the falling wedge though. The inverted head and shoulders can be seen on the 1hr,2hr,3hr, and 4hr charts. Thanks for reading this NON-financial advice from a NON-financial advisor like myself and good luck!
ノート
there are a couple potential descending triangle pattwrns that are also still very valid at the moment too overlapping everything...here is another look at every potential pattern both bearish and bullish right now: s3.amazonaws.com/tradingview/snapshots/x/x5MRvQR3.png免責事項
これらの情報および投稿は、TradingViewが提供または保証する金融、投資、取引、またはその他の種類のアドバイスや推奨を意図したものではなく、またそのようなものでもありません。詳しくは利用規約をご覧ください。
免責事項
これらの情報および投稿は、TradingViewが提供または保証する金融、投資、取引、またはその他の種類のアドバイスや推奨を意図したものではなく、またそのようなものでもありません。詳しくは利用規約をご覧ください。