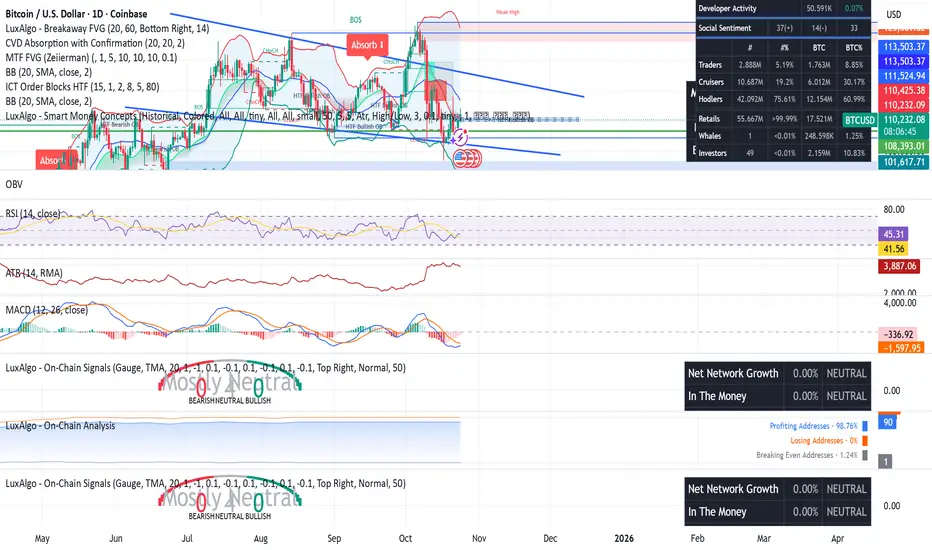
This chart is part of a broader research model studying Bitcoin’s multi-layered market behavior using both technical and on-chain metrics.
The setup integrates volume flow, institutional absorption, and volatility signals to evaluate tactical inflection zones within a broader structural range.
This is not financial advice — the chart is for analytical and educational purposes only, highlighting current market momentum and liquidity dynamics.
トレード稼働中
注文をキャンセル
We operate at the Nexus. We execute the Sovereign Mandate.
免責事項
これらの情報および投稿は、TradingViewが提供または保証する金融、投資、取引、またはその他の種類のアドバイスや推奨を意図したものではなく、またそのようなものでもありません。詳しくは利用規約をご覧ください。
We operate at the Nexus. We execute the Sovereign Mandate.
免責事項
これらの情報および投稿は、TradingViewが提供または保証する金融、投資、取引、またはその他の種類のアドバイスや推奨を意図したものではなく、またそのようなものでもありません。詳しくは利用規約をご覧ください。