https://www.tradingview.com/x/QVMAFQWD/
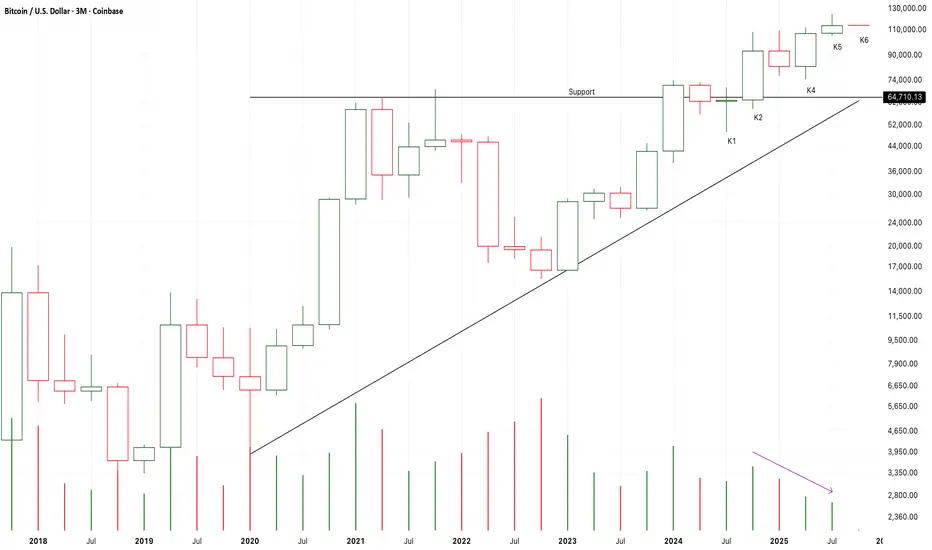
After K2 breaking up a bullish triangle pattern,
The market failed to accelerate to get away from the support line.
From K2 to K6,
There is a trend that both the price and demands keep decreasing to a lowest level.
It verified a weakness of the market.
I am expecting a pull back to retest the support at the following cancels to verify a valid break up of K2.
If K6 is a red candle,
There will be a bearish evening star pattern and the market will most likely fall to test the support.
ノート
K2 and K3 is a bearish engulfing pattern,
K4 nearly close below K1.
K4 also close below the long-term uptrend line.
The demands or supply pressure decreasing to a lowest level in a bullish triangle pattern or a potential bearish head-shoulder pattern.
If K5 still close below the uptrend line,
The market will choose to break down,
And, a bear run may start here.
On the other hand,
If K5 close upon K4,
Another bull run may start here.
トレード終了: ストップロスに到達
After K2 break up the bullish uptrend triangle pattern,
Another bull run start here.
The market will touch 140K area.
It is not safe to short it anymore.
So, I will cut off at least half of my long positions at MSTZ.
If K3 consolidate around the resistance,
It will be a good place to buy it here.
免責事項
この情報および投稿は、TradingViewが提供または推奨する金融、投資、トレード、その他のアドバイスや推奨を意図するものではなく、それらを構成するものでもありません。詳細は利用規約をご覧ください。
免責事項
この情報および投稿は、TradingViewが提供または推奨する金融、投資、トレード、その他のアドバイスや推奨を意図するものではなく、それらを構成するものでもありません。詳細は利用規約をご覧ください。