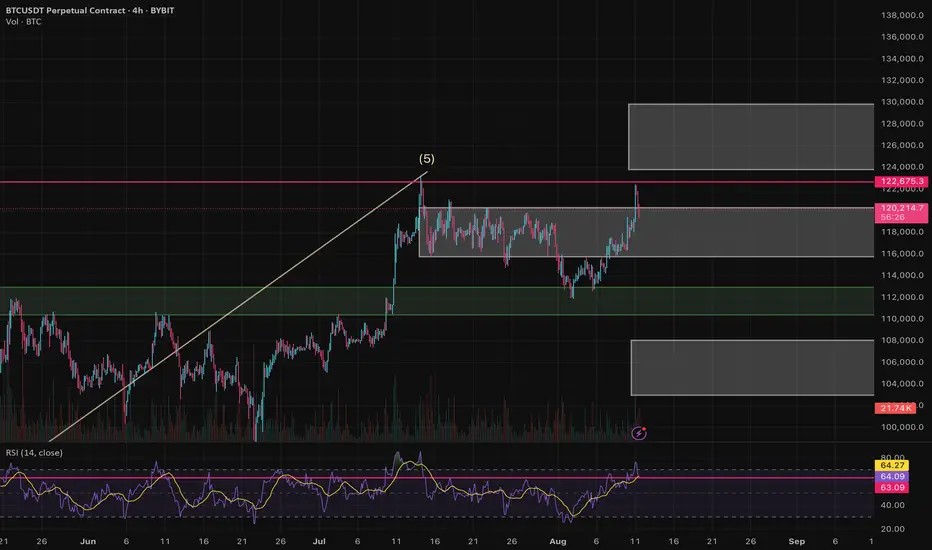
Bitcoin is currently trading near the 122300 resistance zone.
So far it looks more like a false breakout of the 120k level, and on a bigger picture I see the potential for a correction into the 90k–100k range. However, this doesn’t necessarily have to happen in the coming days.
Possible scenarios for the week:
Sideways: accumulation within the 115k–120k range.
Bullish scenario: a daily close above 120500 could open the way for a rally toward the 125k–130k zone.
Bearish scenario: if price drops below 115k, I expect a move toward the 102k–107k area. The green zone (~111k) could provide strong support, as it has previously held the price.
RSI on the daily chart is at 63, very close to the overbought zone. A breakout above 120500 could extend the rally, but the risk of a pullback is high.
Disclaimer: The author’s opinion may not align with yours.

 BTCUSDT.P
So far it looks more like a false breakout of the 120k level, and on a bigger picture I see the potential for a correction into the 90k–100k range. However, this doesn’t necessarily have to happen in the coming days.
Possible scenarios for the week:
Sideways: accumulation within the 115k–120k range.
Bullish scenario: a daily close above 120500 could open the way for a rally toward the 125k–130k zone.
Bearish scenario: if price drops below 115k, I expect a move toward the 102k–107k area. The green zone (~111k) could provide strong support, as it has previously held the price.
RSI on the daily chart is at 63, very close to the overbought zone. A breakout above 120500 could extend the rally, but the risk of a pullback is high.
Disclaimer: The author’s opinion may not align with yours.
免責事項
これらの情報および投稿は、TradingViewが提供または保証する金融、投資、取引、またはその他の種類のアドバイスや推奨を意図したものではなく、またそのようなものでもありません。詳しくは利用規約をご覧ください。
免責事項
これらの情報および投稿は、TradingViewが提供または保証する金融、投資、取引、またはその他の種類のアドバイスや推奨を意図したものではなく、またそのようなものでもありません。詳しくは利用規約をご覧ください。