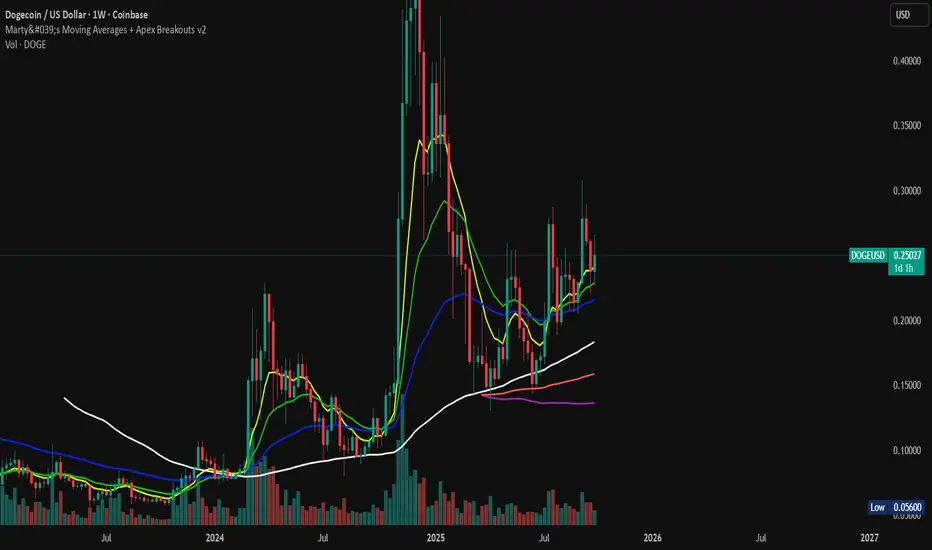
The chart is peeling up on the macro and showing that parabolic shape we all expect. You can expect a pump following Bitcoin's pending melt up.

The weekly timeframe shows confluence of bollinger bands indicating a support at the 1.25standard dev 225period bollinger band. Wave PM is showing compression
It is the same story on the daily time frame


On the lower timeframes there is an active mean reversion occurring. I expect price to reach 0.24380 as a good place to buy in anticipation of the bullrun's most profitable months.
The weekly timeframe shows confluence of bollinger bands indicating a support at the 1.25standard dev 225period bollinger band. Wave PM is showing compression
It is the same story on the daily time frame
On the lower timeframes there is an active mean reversion occurring. I expect price to reach 0.24380 as a good place to buy in anticipation of the bullrun's most profitable months.
CryptoCheck Education / Buy & Sell Alerts
Trading Group 5 day FREE trial >>> discord.gg/jJG5EYA
More Info >>> thecryptocheck.com
Trading Group 5 day FREE trial >>> discord.gg/jJG5EYA
More Info >>> thecryptocheck.com
関連の投稿
免責事項
これらの情報および投稿は、TradingViewが提供または保証する金融、投資、取引、またはその他の種類のアドバイスや推奨を意図したものではなく、またそのようなものでもありません。詳しくは利用規約をご覧ください。