# DXY (US Dollar Index) Technical Analysis & Forecast
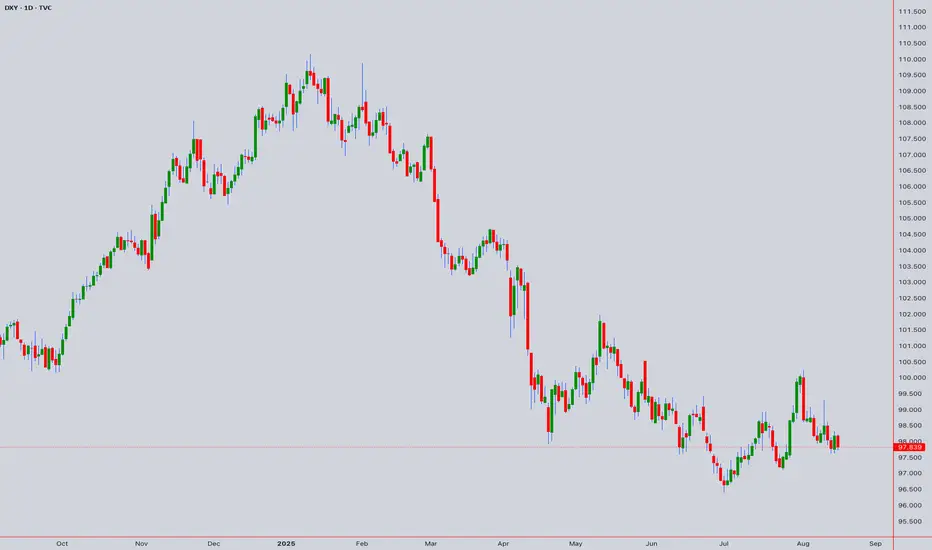
**Base Price:** 97.839 (August 16, 2025 - 12:55 AM)
## Executive Summary
The DXY at 97.839 shows the USD in a consolidation phase near key technical levels. Multiple analytical frameworks converge around critical support/resistance zones, suggesting an imminent directional breakout within the next trading sessions.
## Japanese Candlestick Analysis
### Intraday Patterns (5M-1H)
- **Current Formation:** Doji-like indecision around 97.85 level
- **Key Reversal Zones:** 97.50 (Hammer potential), 98.20 (Shooting Star zone)
- **Momentum Candles:** Watch for Marubozu above 98.00 or below 97.60
- **Evening Star Setup:** Three-candle reversal pattern completion around 98.15
- **Morning Star Potential:** Bullish reversal signal near 97.45 support
### Swing Patterns (4H-Monthly)
- **Engulfing Patterns:** Critical at 98.50 weekly resistance and 97.00 monthly support
- **Harami Cross:** Indecision pattern suggesting range-bound action
- **Piercing Line/Dark Cloud:** Key reversal patterns at major S/R levels
- **Three White Soldiers:** Bullish continuation above 98.00
- **Three Black Crows:** Bearish breakdown below 97.50
## Harmonic Pattern Analysis
### M & W Formations
- **Double Top (M):** Resistance confluence at 98.80-99.00 zone
- **Neckline:** Critical break level at 97.25 for M-pattern completion
- **Double Bottom (W):** Support structure around 96.50-96.80
- **W-Pattern Target:** Bullish objective at 99.20-99.50 on completion
- **Measured Move:** M-top target 96.00, W-bottom target 99.00
### ABCD Pattern Analysis
- **Bullish ABCD:** Current structure suggests C-point at 97.20, D-target 99.80
- **Bearish ABCD:** Alternative count with D-wave completion at 96.20
- **AB=CD Equality:** Time and price symmetry around 98.25 pivot
- **Extension Ratios:**
- 127.2% extension at 99.45
- 161.8% extension at 100.20
- 200% extension at 101.50
## Elliott Wave Analysis
### Primary Count
- **Current Position:** Wave 4 correction of larger degree impulse from 94.50
- **Wave Structure:**
- Wave 1: 94.50 → 96.80
- Wave 2: 96.80 → 95.20
- Wave 3: 95.20 → 98.90
- Wave 4: 98.90 → 97.20 (current)
- Wave 5 Target: 100.50-101.20
### Alternative Count
- **ABC Correction:** Large degree correction from 105.00 highs
- **A-Wave:** 105.00 → 100.80
- **B-Wave:** 100.80 → 99.20 (current)
- **C-Wave Target:** 94.00-95.50
### Time Projections
- **Wave 4 Completion:** 3-5 trading days
- **Wave 5 Duration:** 8-13 days
- **Cycle Completion:** 21-34 days
## Wyckoff Analysis
### Market Structure
- **Phase:** Late accumulation or early distribution
- **Trading Range:** 97.00-99.00 (established range)
- **Point of Support (PS):** 97.20 level
- **Secondary Test (ST):** Current price action around 97.85
- **Sign of Strength (SOS):** Break above 98.50 with volume
- **Last Point of Support (LPS):** Final test around 97.40
### Volume Characteristics
- **Accumulation Signals:** High volume on declines, low volume on rallies
- **Distribution Signals:** High volume on rallies, climactic action above 98.50
- **No Demand:** Weak rallies with declining volume
- **Stopping Volume:** Heavy volume at support levels
## W.D. Gann Theory Analysis
### Time Theory
- **Natural Cycles:** 30, 60, 90, 120-day cycles active
- **Anniversary Dates:** Previous major highs at 105.00 (time squares)
- **Seasonal Pattern:** USD strength typically in Q3-Q4
- **Time Windows:**
- Minor: 7-10 days
- Intermediate: 21-30 days
- Major: 90-120 days
### Square of 9 Analysis
- **Current Position:** 97.839 sits at 347° on the wheel
- **Key Angles:**
- 0°/360°: 98.00 (major resistance)
- 45°: 97.20 (support)
- 90°: 98.80 (resistance)
- 180°: 96.40 (major support)
- 270°: 99.60 (major resistance)
### Price Targets from Square
- **Bullish Targets:** 98.44, 99.25, 100.69
- **Bearish Targets:** 97.21, 96.49, 95.36
### Angle Theory
- **1x1 Angle:** Primary trendline from 94.50 low at 97.60
- **2x1 Angle:** Acceleration line at 98.20
- **1x2 Angle:** Support line at 97.00
- **Fan Lines:** Multiple confluence zones at 97.25, 98.15, 99.05
### Squaring Price and Time
- **Price Squares:** 97.00, 98.00, 99.00, 100.00
- **Time Squares:** 144 hours (6 days), 233 hours (10 days)
- **Geometric Harmony:** 50% level at 97.50, 62% at 98.10
## Ichimoku Kinko Hyo Analysis
### Cloud (Kumo) Analysis
- **Current Position:** Price trading above cloud (bullish bias)
- **Cloud Support:** 97.20-97.40 zone
- **Future Cloud:** Bearish twist in 26 periods around 98.60
- **Cloud Thickness:** Medium strength S/R levels
### Signal Line Analysis
- **Tenkan-sen (9):** 97.75 - short-term momentum line
- **Kijun-sen (26):** 97.55 - medium-term trend line
- **Senkou Span A:** 97.65 (leading span)
- **Senkou Span B:** 97.30 (leading span)
- **Chikou Span:** Confirming current price action strength
### Trading Signals
- **TK Cross:** Tenkan above Kijun (weak bullish)
- **Price vs Kijun:** Above baseline (bullish bias)
- **Cloud Break:** Monitor 97.20 break for bearish signal
## Technical Indicators Analysis
### RSI (Relative Strength Index)
- **14-Period RSI:** 52.8 (neutral zone)
- **Overbought Level:** >70 (watch 98.20+ levels)
- **Oversold Level:** <30 (watch 97.00- levels)
- **Divergence Signals:** Hidden bullish divergence on 4H timeframe
- **Trend Confirmation:** Break above 55 confirms bullish momentum
### Bollinger Bands
- **Upper Band:** 98.45 (immediate resistance)
- **Middle Band (20 SMA):** 97.80 (dynamic support/resistance)
- **Lower Band:** 97.15 (immediate support)
- **Band Width:** Moderate volatility (expansion expected)
- **Squeeze Indicator:** Potential breakout setup forming
### VWAP Analysis
- **Daily VWAP:** 97.72 (key pivot level)
- **Weekly VWAP:** 97.91 (resistance)
- **Monthly VWAP:** 98.15 (major resistance)
- **Volume Profile:** High volume node at 97.50, 98.10
- **VWAP Deviation:** +1 std dev at 98.20, -1 std dev at 97.30
### Moving Averages
- **SMA 20:** 97.78 (short-term trend)
- **SMA 50:** 97.45 (medium-term support)
- **SMA 200:** 96.80 (long-term bullish above this)
- **EMA 8:** 97.85 (immediate dynamic resistance)
- **EMA 21:** 97.70 (key dynamic support)
- **WMA 10:** 97.82 (weighted recent price bias)
## Multi-Timeframe Analysis
### Intraday Analysis
#### 5-Minute Timeframe
- **Trend:** Sideways with upward bias
- **Range:** 97.75-97.95 immediate trading range
- **Scalping Levels:** Buy 97.78, Sell 97.88
- **Breakout Levels:** Above 97.95 or below 97.75
#### 15-Minute Timeframe
- **Pattern:** Ascending triangle formation
- **Apex:** Around 97.90 level
- **Time Target:** Next 2-3 hours for breakout
- **Volume:** Declining (coiling for move)
#### 30-Minute Timeframe
- **Structure:** Higher lows pattern since 97.20
- **Resistance:** 98.00 psychological level
- **Support:** 97.60 swing low
- **Momentum:** Neutral to slightly bullish
#### 1-Hour Timeframe
- **Trend:** Corrective move within larger uptrend
- **Key Level:** 98.20 hourly resistance
- **Support Zone:** 97.40-97.60
- **Next Move:** 4-6 hour window for direction
#### 4-Hour Timeframe
- **Pattern:** Bull flag consolidation
- **Pole:** Move from 97.00 to 98.90
- **Flag:** Current consolidation 97.20-98.20
- **Target:** 99.80-100.20 on upside break
- **Invalidation:** Break below 97.00
### Swing Analysis
#### Daily Timeframe
- **Primary Trend:** Bullish since July 2025
- **Current Phase:** Healthy pullback/consolidation
- **Key Resistance:** 99.00-99.20 zone
- **Major Support:** 96.80-97.00 zone
- **Expected Duration:** 5-8 trading days
#### Weekly Timeframe
- **Long-term Trend:** Sideways to up since Q2 2025
- **Weekly Range:** 96.50-99.50
- **Momentum:** Neutral with bullish undertone
- **Critical Level:** Weekly close above 98.50
#### Monthly Timeframe
- **Macro Trend:** Recovery from 2024 lows
- **Monthly Resistance:** 100.00-101.00 zone
- **Monthly Support:** 95.00-96.00 zone
- **Cycle Position:** Mid-cycle consolidation
## Key Levels & Price Targets
### Critical Support Levels
1. **97.60** - Immediate support (4H swing low)
2. **97.40** - Minor support (Gann angle)
3. **97.20** - Major support (Ichimoku cloud)
4. **97.00** - Key support (psychological + Wyckoff PS)
5. **96.80** - Weekly support (200 SMA)
6. **96.50** - Monthly support (major swing low)
### Critical Resistance Levels
1. **98.00** - Immediate resistance (psychological + Gann square)
2. **98.20** - Minor resistance (previous swing high)
3. **98.50** - Major resistance (weekly level)
4. **98.90** - Key resistance (recent high)
5. **99.20** - Weekly resistance (harmonic target)
6. **100.00** - Monthly resistance (major psychological)
### Price Projections
#### Bullish Scenario (Probability: 55%)
- **Catalyst:** Break above 98.20 with volume
- **Target 1:** 98.80-99.00
- **Target 2:** 99.50-99.80
- **Target 3:** 100.20-100.50
- **Timeline:** 2-3 weeks
#### Bearish Scenario (Probability: 35%)
- **Catalyst:** Break below 97.40 with volume
- **Target 1:** 97.00-96.80
- **Target 2:** 96.50-96.20
- **Target 3:** 95.80-95.50
- **Timeline:** 1-2 weeks
#### Neutral Scenario (Probability: 10%)
- **Range:** 97.40-98.20
- **Duration:** 1-2 weeks
- **Strategy:** Range trading
- **Breakout:** Eventually expected
## Risk Management Framework
### Position Sizing
- **Conservative:** 1% risk per trade
- **Moderate:** 1.5% risk per trade
- **Aggressive:** 2% risk per trade
### Stop Loss Guidelines
- **Intraday:** 20-30 points from entry
- **Swing:** 50-80 points from entry
- **Long-term:** 100-150 points from entry
### Take Profit Strategy
- **Scale out:** 25% at first target
- **Trail stops:** Above key support/resistance
- **Final target:** Risk-reward minimum 1:2
## Trading Strategies
### Intraday Strategy
- **Long Setup:** Break above 98.00 with volume
- **Entry:** 98.05-98.10
- **Stop:** 97.75
- **Target:** 98.45-98.60
### Swing Strategy
- **Long Setup:** Pullback to 97.40-97.60
- **Entry:** Scale in on support test
- **Stop:** Below 97.00
- **Target:** 99.00-99.50
### Momentum Strategy
- **Breakout Play:** Above 98.50 or below 97.00
- **Volume Confirmation:** Required
- **Follow Through:** Next day continuation
- **Risk:** Tight stops due to false breaks
## Market Outlook Summary
The DXY at 97.839 presents a critical inflection point with multiple technical frameworks suggesting an imminent directional move. The slight bullish bias is supported by:
- Elliott Wave suggesting Wave 5 higher
- Wyckoff accumulation characteristics
- Gann time cycles favoring upward movement
- Ichimoku cloud support holding
However, traders should remain vigilant for:
- False breakouts in current range
- Federal Reserve policy changes
- Global economic developments
- Risk sentiment shifts
**Primary Expectation:** Bullish breakout above 98.20 targeting 99.00+
**Alternative Scenario:** Range continuation 97.40-98.20
**Bearish Scenario:** Break below 97.00 targeting 96.50
*Analysis Date: August 17, 2025*
*Next Update: August 19, 2025*
*Key Event Risk: Federal Reserve communications, Economic data releases*
For those interested in further developing their trading skills based on these types of analyses, consider exploring the mentoring program offered by Shunya dot Trade.(world wide web shunya dot trade)
I welcome your feedback on this analysis, as it will inform and enhance my future work.
Regards,
Shunya.Trade
world wide web shunya dot trade
⚠️ Disclaimer: This post is educational content and does not constitute investment advice, financial advice, or trading recommendations. The views expressed here are based on technical analysis and are shared solely for informational purposes. The stock market is subject to risks, including capital loss, and readers should exercise due diligence before investing. We do not take responsibility for decisions made based on this content. Consult a certified financial advisor for personalized guidance.
I am nothing @shunya.trade
免責事項
これらの情報および投稿は、TradingViewが提供または保証する金融、投資、取引、またはその他の種類のアドバイスや推奨を意図したものではなく、またそのようなものでもありません。詳しくは利用規約をご覧ください。
I am nothing @shunya.trade
免責事項
これらの情報および投稿は、TradingViewが提供または保証する金融、投資、取引、またはその他の種類のアドバイスや推奨を意図したものではなく、またそのようなものでもありません。詳しくは利用規約をご覧ください。