As per the Latest SEBI Mandate, this isn't a Trading/Investment RECOMMENDATION nor for Educational Purposes; it is just for Informational purposes only. The chart data used is 3 Months old, as Showing Live Chart Data is not allowed according to the New SEBI Mandate.
Disclaimer: "I am not a SEBI REGISTERED RESEARCH ANALYST AND INVESTMENT ADVISER."
This analysis is intended solely for informational purposes and should not be interpreted as financial advice. It is advisable to consult a qualified financial advisor or conduct thorough research before making investment decisions.
Price Action Analysis:
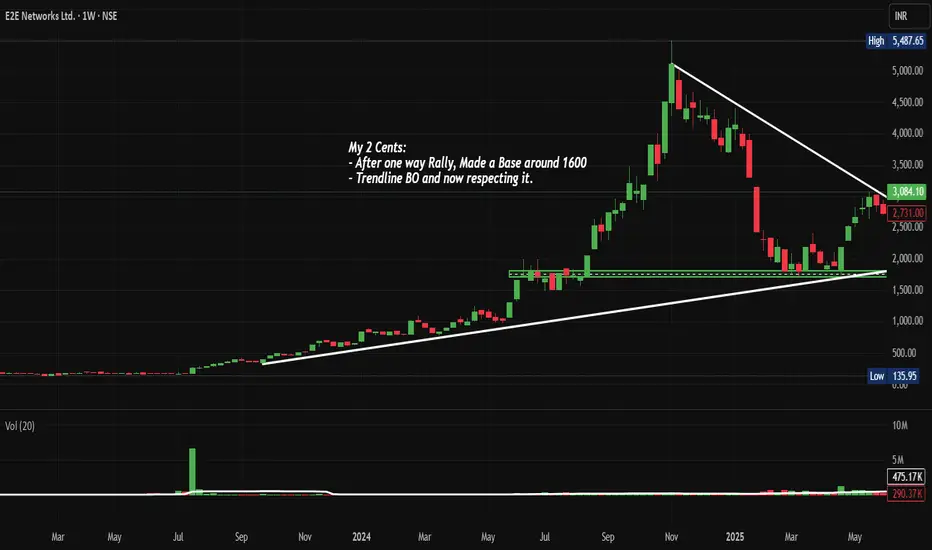
• Stock has formed a massive symmetrical triangle/wedge pattern
• Recent breakout above the upper trendline resistance around 2,900-3,000 levels
• Currently trading at 3,084.10 with strong momentum and above-average volume
• Price action shows a clear shift from consolidation to the trending phase
• Multiple higher lows formation during the consolidation phase indicates underlying strength
Volume Spread Analysis:
• Volume spike visible during the recent breakout, confirming genuine buying interest
• Volume at 813.46K vs average volume of 422.91K, indicating a 92% increase
• Consistent volume support during the base formation phase
• Volume-price confirmation suggests institutional participation
Key Technical Levels:
Support Levels:
• Primary Support: 2,700-2,800 (previous resistance turned support)
• Secondary Support: 2,400-2,500 (triangle breakout level)
• Major Support: 2,000-2,100 (psychological level and previous consolidation zone)
Resistance Levels:
• Immediate Resistance: 3,200-3,300 (next psychological level)
• Major Resistance: 3,500-3,600 (measured move target from triangle)
• All-time High: 5,487.65 (long-term target)
Technical Patterns:
• Symmetrical Triangle: 15-month consolidation pattern completed with upside breakout
• Base Formation: Strong base around 1,600 levels as mentioned in the chart annotation
• Ascending Triangle: Multiple retests of resistance with higher lows
• Volume Breakout Pattern: Confirmed with increased participation
Technical Assessment:
• Trendline Breakout: Clean break above descending trendline resistance
• Price Structure: Shift from consolidation to trending phase
• Momentum: Strong upward momentum post-breakout
• Support-Resistance Flip: Previous resistance becomes new support
Risk Management:
• Maximum Risk: 10% of position size
• Volatility Risk: High (small-cap IT stock)
• Sector Risk: Technology sector concentration
Risk Mitigation:
• Diversification across the IT portfolio
• Position sizing discipline
• Regular monitoring of technical levels
• Sector rotation consideration
Sectoral Analysis:
Industry Overview:
• India's data center industry is undergoing a major transformation, driven by the rapid rise in digital adoption, AI-driven workloads, and cloud computing adoption
• In 2025, E2E Cloud, a leading AI-centric cloud service provider, announced the launch of India's largest NVIDIA H200 GPU infrastructure
• Strong government support for Digital India initiatives
• Growing demand for cloud computing and AI/ML services
Sector Positioning:
• E2E network provides a full-stack AI/ML and GenAI cloud ecosystem designed for scalable, accessible, and cost-efficient deployment of large-scale compute clusters
• E2E Networks provides enterprise-grade GPU computing at a much lower cost by removing the complexity and extra expenses linked to global hyperscale providers
• Strategic focus on AI and machine learning infrastructure
• Competitive advantage in cost-effective cloud solutions
Growth Drivers:
• Increasing AI adoption across industries
• Digital transformation acceleration post-COVID
• Government push for data localization
• Growing startup ecosystem requiring cloud infrastructure
Fundamental Backdrop:
Financial Performance:
• Revenue: 159 Cr with Profit: 34.5 Cr (TTM)
• Revenue from operations slumped -12.63% YoY to Rs 36.11 crore in Q1 FY26
• Profit before tax (PBT) stood at Rs -2.84 crore in Q1 FY26, steeply lower than Rs 10.14 crore in Q1 FY25
• Strong profitability growth trajectory
Market Capitalization & Valuation:
• Mkt Cap: 6,166 Crore (up 10.8% in 1 year)
• Small Cap company classification
Shareholding Pattern:
• Promoter Holding: 40.6%
• Promoter holding has decreased over the last quarter: -3.00%
• Mutual Fund Shareholding in E2E Networks was 1.86%
• Strong promoter holding with some recent reduction
Business Model Strength:
• E2E CDN is a global content delivery network that distributes your content & web pages to end-users with minimal latency
• Asset-light scalable business model
• Recurring revenue from cloud services
• Growing customer base in the AI/ML segment
Key Concerns:
• Though the company is reporting repeated profits, it is not paying out a dividend
• High valuation multiples indicate growth expectations
• Small-cap volatility and liquidity concerns
• Intense competition from global cloud providers
Bull Case:
• Strong technical breakout
• Leadership position in Indian AI/ML cloud infrastructure
• Beneficiary of India's digital transformation
• Scalable business model with high growth potential
Bear Case:
• Expensive valuation with high growth expectations
• Competition from global hyperscalers
• Small-cap inherent volatility
• Dependency on the technology sector performance
Overall Assessment:
• Technically strong setup with favourable risk-reward
• Fundamentally positioned in a high-growth sector
• Regular monitoring required due to small-cap nature
Full Coverage on my Newsletter this Week
Keep in the Watchlist and DOYR.
NO RECO. For Buy/Sell.
📌Thank you for exploring my idea! I hope you found it valuable.
🙏FOLLOW for more
👍BOOST if you found it useful.
✍️COMMENT below with your views.
Meanwhile, check out my other stock ideas on the right side until this trade is activated. I would love your feedback.
As per the Latest SEBI Mandate, this isn't a Trading/Investment RECOMMENDATION nor for Educational Purposes, it is just for Informational purposes only. The chart data used is 3 Months old, as Showing Live Chart Data is not allowed according to the New SEBI Mandate.
Disclaimer: "I am not a SEBI REGISTERED RESEARCH ANALYST AND INVESTMENT ADVISER."
This analysis is intended solely for informational purposes and should not be interpreted as financial advice. It is advisable to consult a qualified financial advisor or conduct thorough research before making investment decisions.
関連の投稿
免責事項
この情報および投稿は、TradingViewが提供または推奨する金融、投資、トレード、その他のアドバイスや推奨を意図するものではなく、それらを構成するものでもありません。詳細は利用規約をご覧ください。
関連の投稿
免責事項
この情報および投稿は、TradingViewが提供または推奨する金融、投資、トレード、その他のアドバイスや推奨を意図するものではなく、それらを構成するものでもありません。詳細は利用規約をご覧ください。