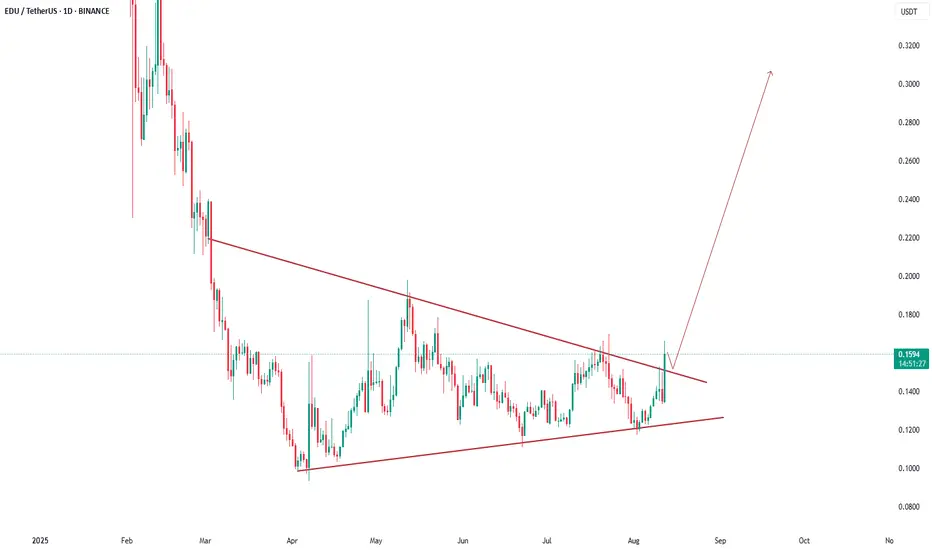
The daily chart for EDU/USDT on Binance shows a breakout above a long-term symmetrical triangle pattern after months of consolidation. Price has surged by over 18% today, supported by strong volume, signaling bullish momentum. If the breakout holds, the chart projection suggests a potential rally toward the $0.30 zone. Traders may watch for retests of the breakout line as possible support before continuation.
This is general information only and not financial advice. For personal guidance, please talk to a licensed professional.
This is general information only and not financial advice. For personal guidance, please talk to a licensed professional.
免責事項
この情報および投稿は、TradingViewが提供または推奨する金融、投資、トレード、その他のアドバイスや推奨を意図するものではなく、それらを構成するものでもありません。詳細は利用規約をご覧ください。
免責事項
この情報および投稿は、TradingViewが提供または推奨する金融、投資、トレード、その他のアドバイスや推奨を意図するものではなく、それらを構成するものでもありません。詳細は利用規約をご覧ください。