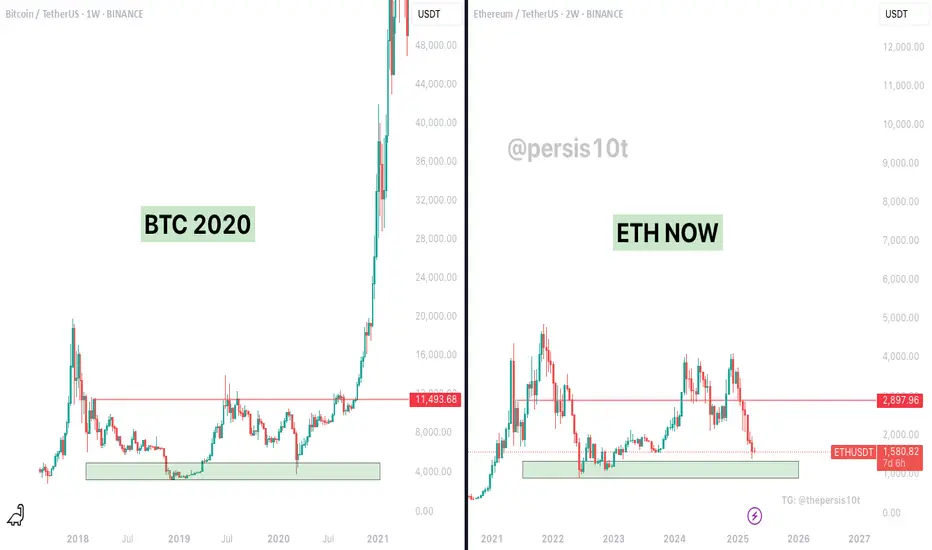
On the left: BTC in 2020 before it exploded from ~$11K to $ 60 K+
On the right: ETH now, sitting on a similar macro support zone and showing a similar multi-year accumulation range.
This Chart Suggests:
BTC (2020) consolidated for years in a tight range between $3K and $ 12K before blasting off.
ETH has now spent over two years ranging between ~ $ 1K and $3K, forming a strong base at support just like BTC did.
The current ETH structure mirrors BTC's pre-bull breakout — clean support retest, fakeouts, and suppressed volatility.
If ETH follows a similar path, the next parabolic expansion could be approaching.
This isn't just about pattern recognition — it's about timing cycles, sentiment shifts, and institutional patience.
“The best trades often feel the most uncomfortable.”
While many are panicking, ETH is printing a macro setup that resembles the beginning of Bitcoin’s strongest run in history.
Are you prepared if ETH goes full BTC 2020 mode?
トレード稼働中
免責事項
これらの情報および投稿は、TradingViewが提供または保証する金融、投資、取引、またはその他の種類のアドバイスや推奨を意図したものではなく、またそのようなものでもありません。詳しくは利用規約をご覧ください。
免責事項
これらの情報および投稿は、TradingViewが提供または保証する金融、投資、取引、またはその他の種類のアドバイスや推奨を意図したものではなく、またそのようなものでもありません。詳しくは利用規約をご覧ください。