Technical Analysis Of EURCAD
1. Current Market Structure
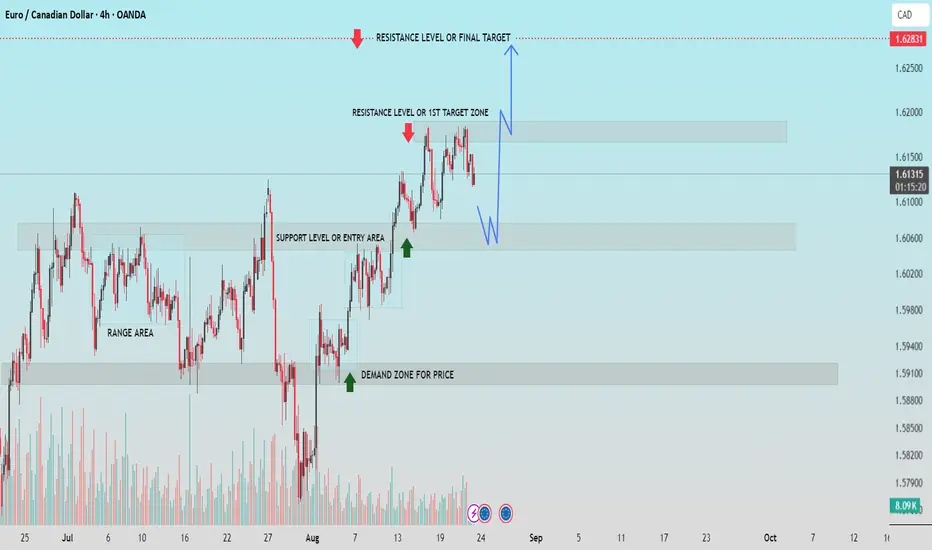
EUR/CAD is trading around 1.6135, consolidating just below the first resistance zone (1.6180). Price has previously broken out from a range and is now in a bullish structure with higher highs and higher lows.
2. Key Support & Demand Zones
* Support Area: Around 1.6060, which acted as an entry area after the breakout.
* Demand Zone: Near 1.5910, where strong buying previously occurred, making it a critical level if deeper pullback happens.
3. Resistance Levels & Targets
* First Resistance / Target Zone: 1.6180, immediate hurdle for bulls.
* Final Resistance / Target: 1.6280, the ultimate bullish target if price maintains upward momentum.
4. Possible Price Scenarios
* Bullish Outlook: If price pulls back to 1.6060 and shows bullish confirmation, we can expect a move towards 1.6180, and eventually 1.6280.
* Bearish Outlook: A break below 1.6060 opens the door for a correction towards 1.5910.
5. Trading Plan
* Bias: Bullish above 1.6060.
* Strategy: Wait for pullback and bullish price action near support before entering long positions. Avoid chasing entries at resistance.
If this helpful for you, press the like button.
1. Current Market Structure
EUR/CAD is trading around 1.6135, consolidating just below the first resistance zone (1.6180). Price has previously broken out from a range and is now in a bullish structure with higher highs and higher lows.
2. Key Support & Demand Zones
* Support Area: Around 1.6060, which acted as an entry area after the breakout.
* Demand Zone: Near 1.5910, where strong buying previously occurred, making it a critical level if deeper pullback happens.
3. Resistance Levels & Targets
* First Resistance / Target Zone: 1.6180, immediate hurdle for bulls.
* Final Resistance / Target: 1.6280, the ultimate bullish target if price maintains upward momentum.
4. Possible Price Scenarios
* Bullish Outlook: If price pulls back to 1.6060 and shows bullish confirmation, we can expect a move towards 1.6180, and eventually 1.6280.
* Bearish Outlook: A break below 1.6060 opens the door for a correction towards 1.5910.
5. Trading Plan
* Bias: Bullish above 1.6060.
* Strategy: Wait for pullback and bullish price action near support before entering long positions. Avoid chasing entries at resistance.
If this helpful for you, press the like button.
トレード稼働中
ノート
active your trades, now entry level トレード終了: 利益確定目標に到達
💸FREE FOREX Signals in Telegram : t.me/FxInsightsHub0
🔹Join Our Telegram Channel, Pure Price Action Based Signals With Chart Analysis.
t.me/FxInsightsHub0
🚀FREE CRYPTO Signals In Telegram: t.me/FxInsightsHub0
🔹Join Our Telegram Channel, Pure Price Action Based Signals With Chart Analysis.
t.me/FxInsightsHub0
🚀FREE CRYPTO Signals In Telegram: t.me/FxInsightsHub0
関連の投稿
免責事項
これらの情報および投稿は、TradingViewが提供または保証する金融、投資、取引、またはその他の種類のアドバイスや推奨を意図したものではなく、またそのようなものでもありません。詳しくは利用規約をご覧ください。