Technical Analysis:
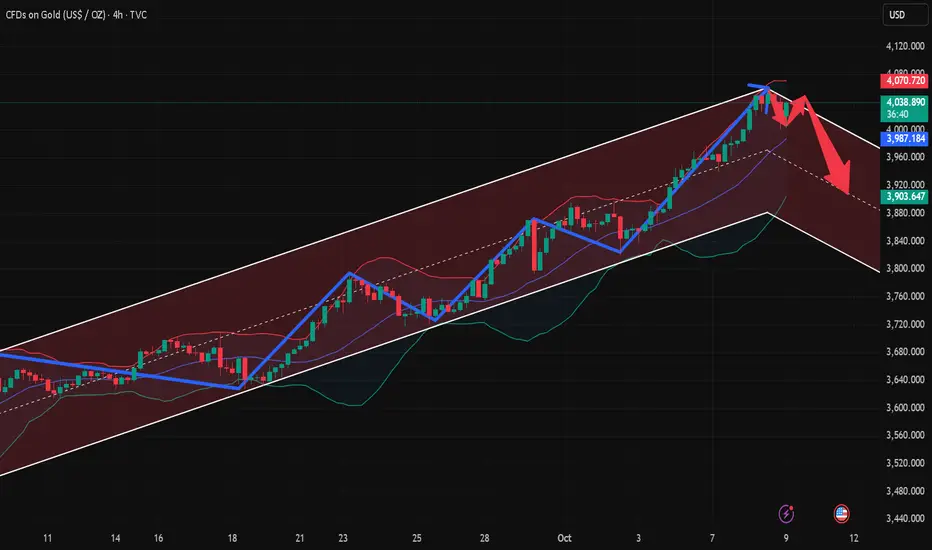
The 4-hour chart shows support at the middle line and near the MA30 moving average, corresponding to 3986 and 3947, respectively. The Bollinger Bands have also begun to narrow, indicating a volatile, compressed, and retest pattern in the 4-hour chart. Focus is currently on the upward pressure of 4032, near the MA5 moving average.
The 3-hour chart saw a rapid drop to 4001 this morning before bottoming out near 4008 and rebounding to 4036. The MACD formed a dead cross with high volume, and the STO indicator is trading at a low level, indicating weak 4-hour volatility. The high point of the morning rebound, the middle line of the hourly chart, has become the current resistance point at 4036. Meanwhile, support between 3999 and 4000 is a key focus today.
On the daily chart, focus on yesterday's highs and lows, 4059, and 3984. For the daily chart to rise, it must not fall below yesterday's lows but must break above yesterday's highs. However, considering the current volatile decline in the 4-hour chart, it is obvious that it will be difficult to go up in the morning session, so 4032 and 4050-59 become today's shorting points; and for the time being, we will focus on the morning low of 4001 and yesterday's low of 3984.
トレード稼働中
Intraday short-term operation strategy:【1】Short position near 4050-54, defense 4060, target 4040-4030
【2】Long position near 4000-03, defense 3997, target 4014-4024-4030
【3】Long position near 3982-84, defense 3976, target 3998-4010
【4】Long position near 3956-58, defense 3950, target 3980-4000
トレード終了: 利益確定目標に到達
I will send the exact entry point in my channel link. If you need it, please click on my link to get it for free.The road to success is not crowded. As long as you choose the right direction and follow the right team, you will be able to move forward.
t.me/david_456654
t.me/david_456654
関連の投稿
免責事項
この情報および投稿は、TradingViewが提供または推奨する金融、投資、トレード、その他のアドバイスや推奨を意図するものではなく、それらを構成するものでもありません。詳細は利用規約をご覧ください。
The road to success is not crowded. As long as you choose the right direction and follow the right team, you will be able to move forward.
t.me/david_456654
t.me/david_456654
関連の投稿
免責事項
この情報および投稿は、TradingViewが提供または推奨する金融、投資、トレード、その他のアドバイスや推奨を意図するものではなく、それらを構成するものでもありません。詳細は利用規約をご覧ください。