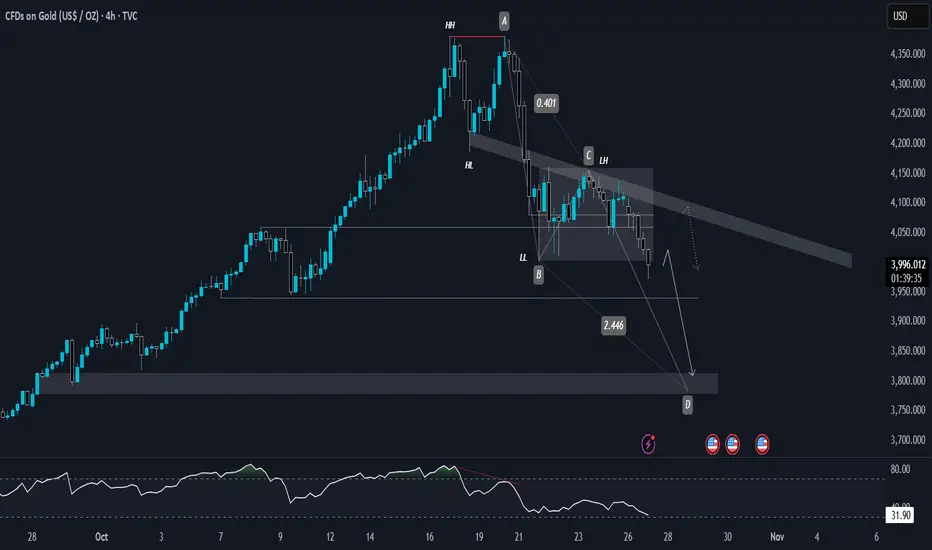
Gold recently formed a clear double top at the all-time high (ATH), accompanied by a bearish divergence on higher timeframes — signaling exhaustion of bullish momentum. That divergence has played out perfectly, aligning with the current bearish market structure.
The price has now broken below the key accumulation range between 4000 and 4149, confirming a shift in sentiment. With the trend consistently printing lower lows (LL) and lower highs (LH), the overall market bias remains bearish.
🔹 Technical Breakdown
We currently have a bearish AB=CD pattern completing near the 3800 zone, which aligns with the Fibonacci golden ratio (0.618) on the D leg.
Although AB=CD is traditionally a bullish harmonic pattern, here it’s being used within a downtrend context to identify a potential reversal or continuation zone — depending on market reaction at D.
Key Zone to Watch:
🟡 3800 – 3840 → Major potential reaction zone (Fib confluence + AB=CD completion).
If sellers hold this level, we could see further downside momentum.

🔹 Daily Chart View
On the daily timeframe, bullish momentum looks weak — every recovery candle is smaller, and volume favors sellers. With the AB=CD pattern confirmation and price failing to reclaim the 40050 zone, the bias stays bearish.
🔹 Weekly Chart Insight
Historically, gold tends to retrace after 9 consecutive straight bullish weekly candles.
From 1990 to 2025, each 9-week rally phase has been followed by a notable correction ranging from 6% to 14%, showing that extended rallies often precede profit-taking phases.
This current rally phase mirrors that same behavior patterns — making a corrective move toward 3800–3700 highly probability.
🧭 Final BIAS
The technical confluence between the bearish structure, double top + divergence, and AB=CD D-leg near golden ratio and 9 week rally gives a high-probability bearish setup.
If 3940 fails to hold, next potential downside target lies near 3900-3775, aligned with long-term structure support.
The price has now broken below the key accumulation range between 4000 and 4149, confirming a shift in sentiment. With the trend consistently printing lower lows (LL) and lower highs (LH), the overall market bias remains bearish.
🔹 Technical Breakdown
We currently have a bearish AB=CD pattern completing near the 3800 zone, which aligns with the Fibonacci golden ratio (0.618) on the D leg.
Although AB=CD is traditionally a bullish harmonic pattern, here it’s being used within a downtrend context to identify a potential reversal or continuation zone — depending on market reaction at D.
Key Zone to Watch:
🟡 3800 – 3840 → Major potential reaction zone (Fib confluence + AB=CD completion).
If sellers hold this level, we could see further downside momentum.
🔹 Daily Chart View
On the daily timeframe, bullish momentum looks weak — every recovery candle is smaller, and volume favors sellers. With the AB=CD pattern confirmation and price failing to reclaim the 40050 zone, the bias stays bearish.
🔹 Weekly Chart Insight
Historically, gold tends to retrace after 9 consecutive straight bullish weekly candles.
From 1990 to 2025, each 9-week rally phase has been followed by a notable correction ranging from 6% to 14%, showing that extended rallies often precede profit-taking phases.
This current rally phase mirrors that same behavior patterns — making a corrective move toward 3800–3700 highly probability.
🧭 Final BIAS
The technical confluence between the bearish structure, double top + divergence, and AB=CD D-leg near golden ratio and 9 week rally gives a high-probability bearish setup.
If 3940 fails to hold, next potential downside target lies near 3900-3775, aligned with long-term structure support.
ノート
700+ Pips Move Secured :-)ノート
関連の投稿
免責事項
これらの情報および投稿は、TradingViewが提供または保証する金融、投資、取引、またはその他の種類のアドバイスや推奨を意図したものではなく、またそのようなものでもありません。詳しくは利用規約をご覧ください。
関連の投稿
免責事項
これらの情報および投稿は、TradingViewが提供または保証する金融、投資、取引、またはその他の種類のアドバイスや推奨を意図したものではなく、またそのようなものでもありません。詳しくは利用規約をご覧ください。