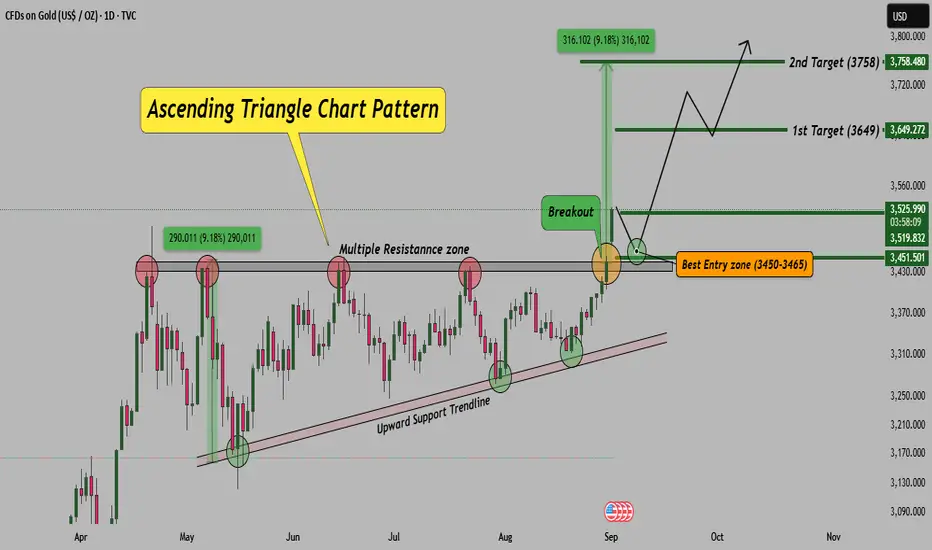
Gold has formed a strong ascending triangle pattern on the daily timeframe. The price has successfully broken above the resistance zone, confirming bullish momentum. Such patterns generally indicate continuation of the uptrend, especially when supported by volume and strong price action.
Chart Observation:
Note: If levels sustain and setup remains intact, I will share live trade updates in real time. Stay tuned.
Disclaimer: This analysis is for educational purposes only. Please do your own research or consult your financial advisor before taking trades.
Chart Observation:
- As long as price holds above 3,450, the bullish setup remains valid.
- A retest of the breakout zone can provide the best risk-to-reward entry opportunity.
- Traders should keep an eye on volume confirmation while entering trades.
Note: If levels sustain and setup remains intact, I will share live trade updates in real time. Stay tuned.
Disclaimer: This analysis is for educational purposes only. Please do your own research or consult your financial advisor before taking trades.
Rahul Pal | BD Manager @CoinW Exchange Dubai
Helping KOLs, Partners earn up to 70% rebate
Recommended Broker: tinyurl.com/RahulCoinW
Free Telegram: spf.bio/c1lkb
Website:realbullstrading.com
Signals:wa.me/919560602464
Helping KOLs, Partners earn up to 70% rebate
Recommended Broker: tinyurl.com/RahulCoinW
Free Telegram: spf.bio/c1lkb
Website:realbullstrading.com
Signals:wa.me/919560602464
関連の投稿
免責事項
この情報および投稿は、TradingViewが提供または推奨する金融、投資、トレード、その他のアドバイスや推奨を意図するものではなく、それらを構成するものでもありません。詳細は利用規約をご覧ください。