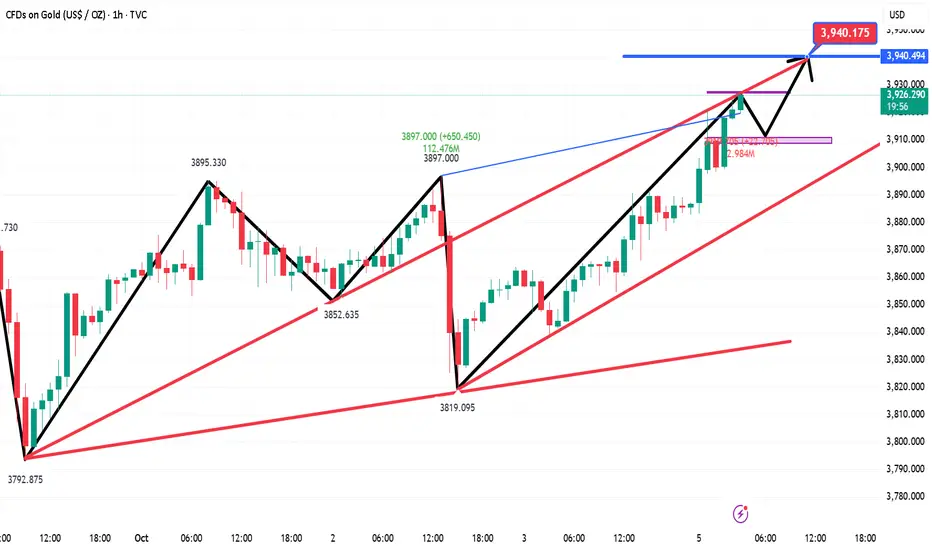
Gold prices are currently moving out of a narrow range of highs on the daily chart. The K-line chart continues to maintain a relatively stable upward trend along the short-term moving average. Watch for any pullbacks on the daily chart to confirm a secondary upward trend. Focus on the support zone around 3900 in the short term. On the 4-hour chart, the price broke through the previous resistance zone, and the short-term moving average began to diverge upward, indicating a relatively strong short-term trend. On the hourly chart, the intraday pullbacks were neither strong nor prolonged, and the K-line chart continues to maintain a relatively strong trend along the short-term moving average. Some divergence is showing on the short-term chart, so watch for short-term adjustments.
Trading Strategy:
BUY: 3910 TP1:3925 TP2:3940
SELL: 3940 TP1:3910 TP2:3900
Trading Strategy:
BUY: 3910 TP1:3925 TP2:3940
SELL: 3940 TP1:3910 TP2:3900
トレード稼働中
Traders, if you like this idea or you have your own opinion on it, please write it in the comments. I will be happy toトレード終了: 利益確定目標に到達
ノート
This is in perfect agreement with our analysis. Gold started to decline after reaching 3940. Currently it is at 30, with a profit of 10 points.ノート
ノート
Short-term target has been completed, profit point 20The road to success is not crowded. As long as you choose the right direction and follow the right team, you will be able to move forward.
t.me/david_456654
t.me/david_456654
関連の投稿
免責事項
これらの情報および投稿は、TradingViewが提供または保証する金融、投資、取引、またはその他の種類のアドバイスや推奨を意図したものではなく、またそのようなものでもありません。詳しくは利用規約をご覧ください。
The road to success is not crowded. As long as you choose the right direction and follow the right team, you will be able to move forward.
t.me/david_456654
t.me/david_456654
関連の投稿
免責事項
これらの情報および投稿は、TradingViewが提供または保証する金融、投資、取引、またはその他の種類のアドバイスや推奨を意図したものではなく、またそのようなものでもありません。詳しくは利用規約をご覧ください。