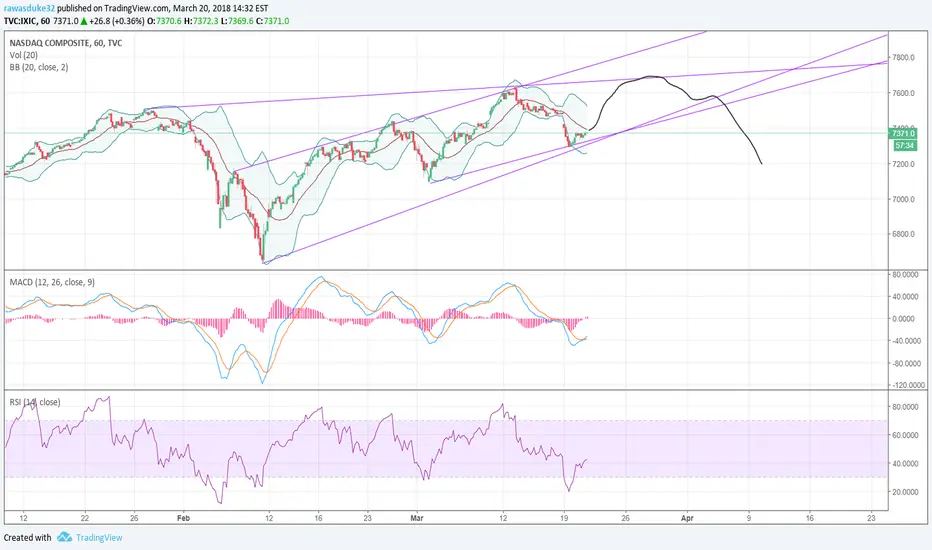
On the H1 the MACD and RSI are looking nice and bull. Chart just bounced of support and possibly headed up to resistance at 7680ish. The daily chart is showing the macd beginning to cross downwards, which could bring a correction in the near future. After the first week of April were getting close to the pinch point of the wedge. It could still break up, but we're also moving in a ascending channel, which typically breaks downwards.
免責事項
これらの情報および投稿は、TradingViewが提供または保証する金融、投資、取引、またはその他の種類のアドバイスや推奨を意図したものではなく、またそのようなものでもありません。詳しくは利用規約をご覧ください。
免責事項
これらの情報および投稿は、TradingViewが提供または保証する金融、投資、取引、またはその他の種類のアドバイスや推奨を意図したものではなく、またそのようなものでもありません。詳しくは利用規約をご覧ください。