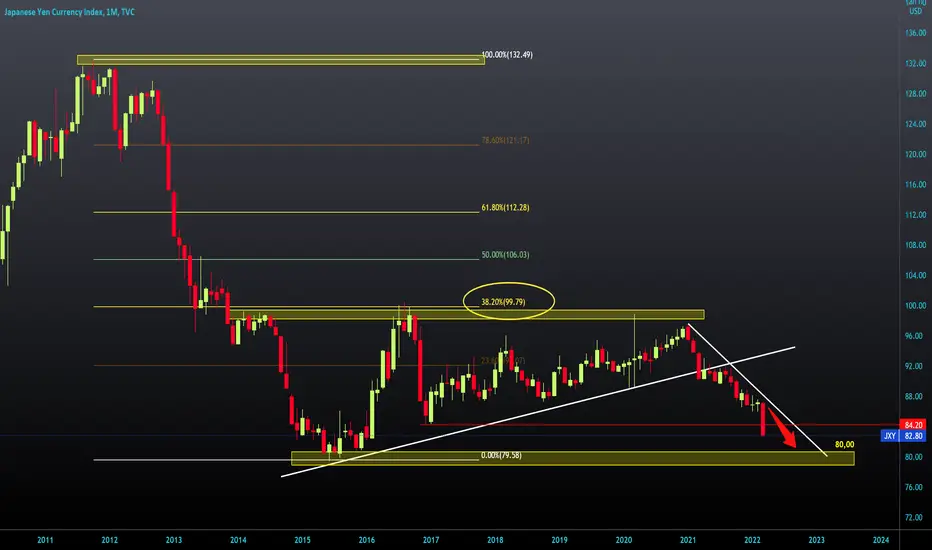
First of all, looking at the chart, we see that we have been in the bearish trend since January last year.
Second, the JPY index failed to form a new higher high compared to the August 2016 high.
By setting the Fibonacci level, we see that the index stopped at 38.2% Fibonacci level.
This is a sign of continuing the bearish trend
JPY breaks below 84,200, our previous support from December 2016.
We are looking for the next target and potential support in the zone of about 80,000 (support zone from 2015).
Bank of Japan continues with soft monetary policy
Based on this analysis, we can expect a further weakening of the JPY index in the coming months.
Free telegram channel t.me/alexmasterforex
免責事項
これらの情報および投稿は、TradingViewが提供または保証する金融、投資、取引、またはその他の種類のアドバイスや推奨を意図したものではなく、またそのようなものでもありません。詳しくは利用規約をご覧ください。
Free telegram channel t.me/alexmasterforex
免責事項
これらの情報および投稿は、TradingViewが提供または保証する金融、投資、取引、またはその他の種類のアドバイスや推奨を意図したものではなく、またそのようなものでもありません。詳しくは利用規約をご覧ください。