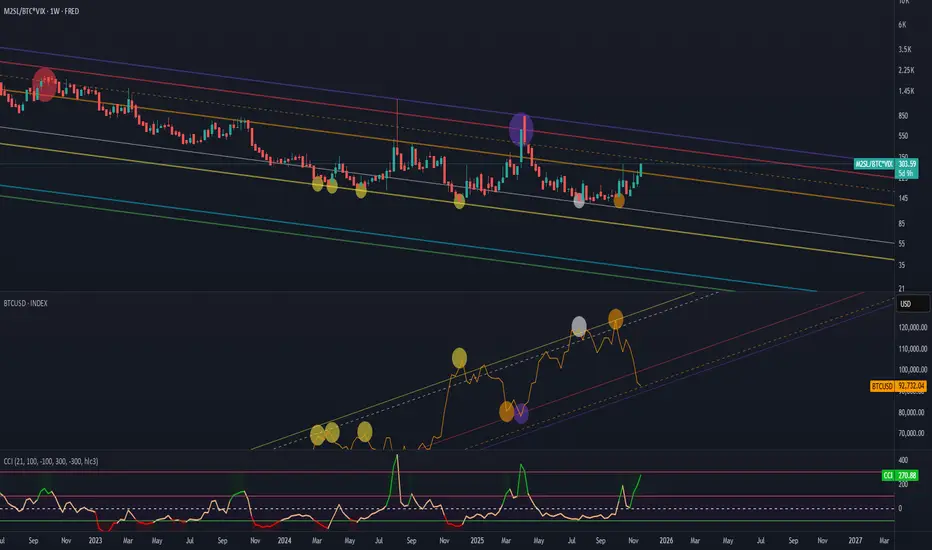
It shows the ratio of global liquidity (M2) to Bitcoin’s market capitalization, amplified by market fear (VIX), relative to BTCUSD.
Thanks to this formula, we have an understanding of which phase of the market we are currently in.
In this case the CCI indicator shows:
overbought conditions — meaning money is outside the market and
oversold conditions — meaning there is too much money in the market and it’s time to sell
FRED:M2SL/CRYPTOCAP:BTC*TVC:VIX
For some reason the Bitcoin chart isn’t displaying with all the markings, so I’ll attach a screenshot below.
トレード稼働中
For those who don’t understand the concept at all:the upper chart represents money and the lower chart represents Bitcoin.
The higher the values on the upper chart — the more money is OUT of the market
The lower it goes — the more money is FLOWING inside the market
関連の投稿
免責事項
この情報および投稿は、TradingViewが提供または推奨する金融、投資、トレード、その他のアドバイスや推奨を意図するものではなく、それらを構成するものでもありません。詳細は利用規約をご覧ください。
関連の投稿
免責事項
この情報および投稿は、TradingViewが提供または推奨する金融、投資、トレード、その他のアドバイスや推奨を意図するものではなく、それらを構成するものでもありません。詳細は利用規約をご覧ください。