Marico Ltd.—Cup & Handle Breakout Forming? ☕️📈
📆 Date: April 10, 2025
📊 Chart Analysis:
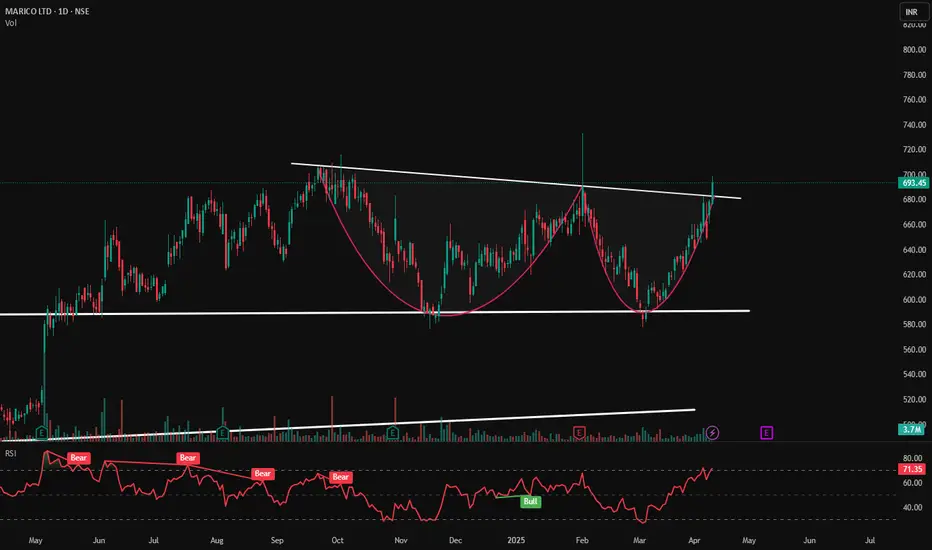
Marico is showing a classic "cup & handle" pattern, a bullish continuation setup. The price has successfully broken above the neckline resistance, indicating a potential for upward continuation if volume sustains.
📌 Key Levels:
🛑 Resistance (neckline—now flipped to support): ₹685
✅ Support (Base of Cup): ₹580
🔼 Immediate Resistance Targets: ₹710 ➡️ ₹735 ➡️ ₹765
📈 Indicators & Technicals:
☕ Cup & Handle Pattern clearly visible with a rounded bottom and breakout above resistance.
🔍 RSI at 71.35 shows bullish momentum but is slightly overbought —a sign of strength with caution.
💹 Volume steadily increasing — confirms accumulation phase and breakout intent.
🟥 Multiple "Bear" RSI icons (prior weakness) followed by a ✅ "Bull" label hinting at a momentum shift.
📉 Bearish divergence in RSI is now getting invalidated by price strength and pattern breakout.
🧠 Trade Plan:
📌 Entry near ₹685–₹695 breakout zone
🎯 Targets: ₹710 ➡️ ₹735 ➡️ ₹765
❌ SL: ₹670 (below neckline)
📌 Disclaimer: For educational purposes only. Do your own research or consult with a SEBI-registered advisor before trading or investing
📆 Date: April 10, 2025
📊 Chart Analysis:
Marico is showing a classic "cup & handle" pattern, a bullish continuation setup. The price has successfully broken above the neckline resistance, indicating a potential for upward continuation if volume sustains.
📌 Key Levels:
🛑 Resistance (neckline—now flipped to support): ₹685
✅ Support (Base of Cup): ₹580
🔼 Immediate Resistance Targets: ₹710 ➡️ ₹735 ➡️ ₹765
📈 Indicators & Technicals:
☕ Cup & Handle Pattern clearly visible with a rounded bottom and breakout above resistance.
🔍 RSI at 71.35 shows bullish momentum but is slightly overbought —a sign of strength with caution.
💹 Volume steadily increasing — confirms accumulation phase and breakout intent.
🟥 Multiple "Bear" RSI icons (prior weakness) followed by a ✅ "Bull" label hinting at a momentum shift.
📉 Bearish divergence in RSI is now getting invalidated by price strength and pattern breakout.
🧠 Trade Plan:
📌 Entry near ₹685–₹695 breakout zone
🎯 Targets: ₹710 ➡️ ₹735 ➡️ ₹765
❌ SL: ₹670 (below neckline)
📌 Disclaimer: For educational purposes only. Do your own research or consult with a SEBI-registered advisor before trading or investing
トレード終了: 利益確定目標に到達
The first and second resistance level has been touched. If the trend is to continue, it's important to follow a trailing stop-loss strategy and patiently wait for the price to approach the third resistance level.免責事項
これらの情報および投稿は、TradingViewが提供または保証する金融、投資、取引、またはその他の種類のアドバイスや推奨を意図したものではなく、またそのようなものでもありません。詳しくは利用規約をご覧ください。
免責事項
これらの情報および投稿は、TradingViewが提供または保証する金融、投資、取引、またはその他の種類のアドバイスや推奨を意図したものではなく、またそのようなものでもありません。詳しくは利用規約をご覧ください。