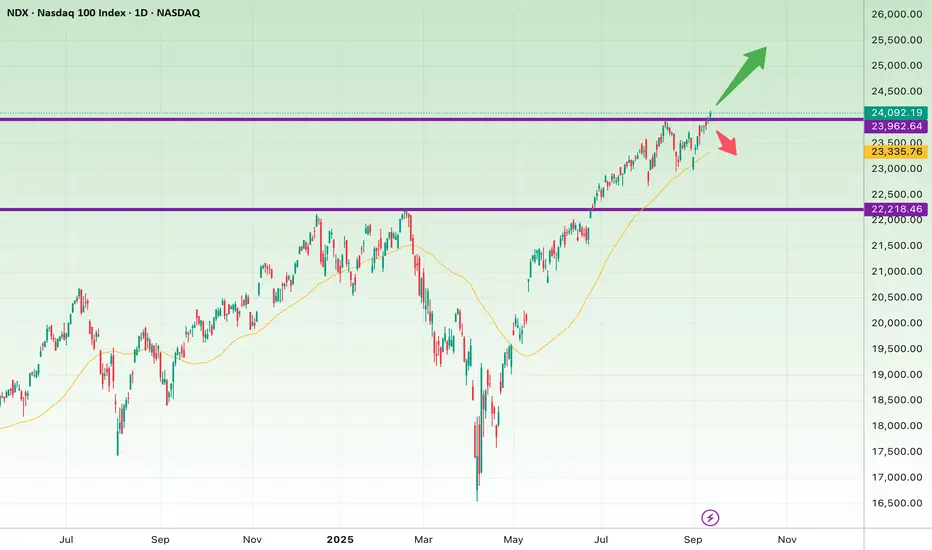
The NDX chart shows that after a strong rally from the 22,200 support zone, the index is now testing a key resistance around 23,950 – 24,100.
Bullish Scenario:
If the daily or weekly candle closes firmly above 24,100, the path opens toward 24,800 – 25,000. Breaking this resistance could trigger a new wave of buying momentum.
Bearish Scenario:
If the index fails to break higher and sellers step in, we may see a pullback toward 23,500 and possibly 22,200.
The 50-day moving average (yellow line) near 23,300 – 23,400 will act as an important mid-term support.
Conclusion:
The market is at a decisive turning point. A breakout above 24,100 signals continuation of the bull run, while rejection here could trigger a deeper correction.
免責事項
これらの情報および投稿は、TradingViewが提供または保証する金融、投資、取引、またはその他の種類のアドバイスや推奨を意図したものではなく、またそのようなものでもありません。詳しくは利用規約をご覧ください。
免責事項
これらの情報および投稿は、TradingViewが提供または保証する金融、投資、取引、またはその他の種類のアドバイスや推奨を意図したものではなく、またそのようなものでもありません。詳しくは利用規約をご覧ください。