Using only the Money flow index is dangerous game do your own analysis!...
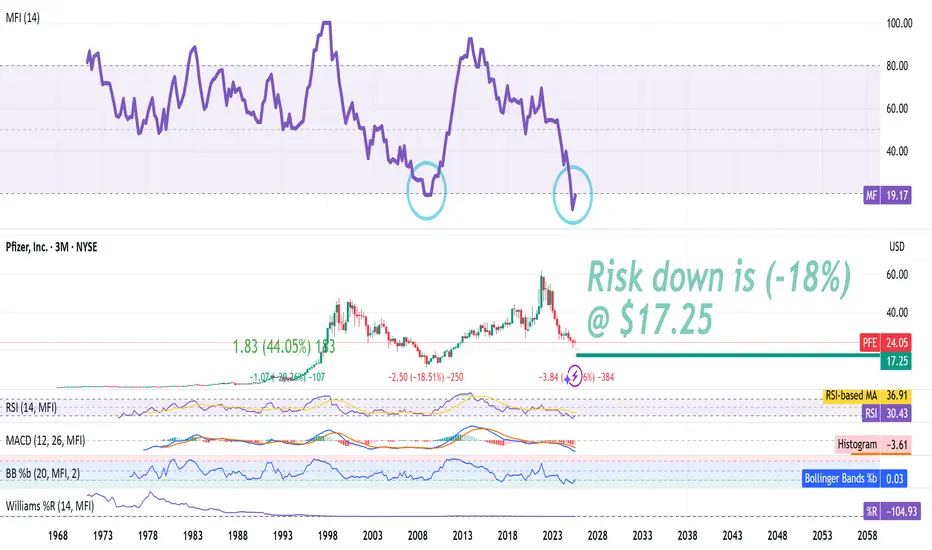
The Money Flow Index (MFI) is a technical indicator that uses price and volume to identify overbought or oversold conditions in a security, similar to the Relative Strength Index (RSI) but incorporating volume data. It's a momentum oscillator ranging from 0 to 100, with readings above 80 often suggesting an overbought market (potential sell signal) and readings below 20 indicating an oversold market (potential buy signal). Traders use the MFI to confirm price trends, identify divergences (warnings of trend reversals), and gauge investor conviction behind price moves
The Money Flow Index (MFI) is a technical indicator that uses price and volume to identify overbought or oversold conditions in a security, similar to the Relative Strength Index (RSI) but incorporating volume data. It's a momentum oscillator ranging from 0 to 100, with readings above 80 often suggesting an overbought market (potential sell signal) and readings below 20 indicating an oversold market (potential buy signal). Traders use the MFI to confirm price trends, identify divergences (warnings of trend reversals), and gauge investor conviction behind price moves
トレード稼働中
The probabilities is we go up with our risk down as a "Red flag"トレード終了: 利益確定目標に到達
Hurst's cycles 18Ys-18 Msノート
+ 24% bullish move is the least comparing it with past signals 2001-2007 period !ノート
50% Retracements is at $ 23.4861% ....
78%...
ノート
Relative to SPX !!!ノート
Q3-Q4 2025 is a probable generational buying opportunity, or not !ノート
P/E, PS & total revenues are 20% above the financial crisis 2001-2007 !!!So we can hit our trough soon or we go down further like 2007 !
ノート
still down on this (-.28%) good draw down as we have reached over (-12%) last month !!!I do more in depth studies of stocks on my twitter account. Hope you would enjoy it there as you are enjoying it here.
****** Past performance is no guarantee of future results***
twitter.com/samitrading1
****** Past performance is no guarantee of future results***
twitter.com/samitrading1
免責事項
この情報および投稿は、TradingViewが提供または推奨する金融、投資、トレード、その他のアドバイスや推奨を意図するものではなく、それらを構成するものでもありません。詳細は利用規約をご覧ください。
I do more in depth studies of stocks on my twitter account. Hope you would enjoy it there as you are enjoying it here.
****** Past performance is no guarantee of future results***
twitter.com/samitrading1
****** Past performance is no guarantee of future results***
twitter.com/samitrading1
免責事項
この情報および投稿は、TradingViewが提供または推奨する金融、投資、トレード、その他のアドバイスや推奨を意図するものではなく、それらを構成するものでもありません。詳細は利用規約をご覧ください。