📊 Key levels & structure
Based on current weekly chart readings, recent pivot data and visible support/resistance zones:
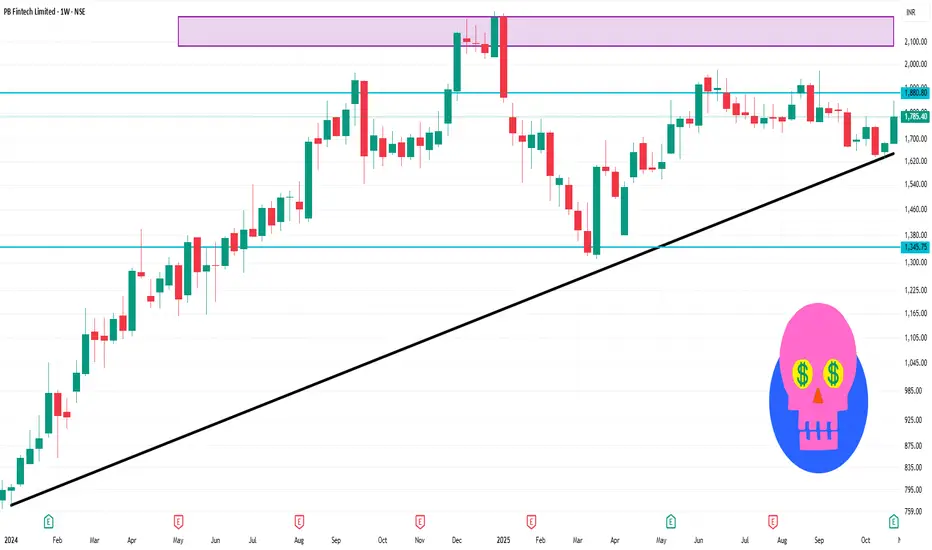
Resistance zone: ~ ₹1,775-1,825 — price has been tested around this area, acting as a cap.
Support zone: ~ ₹1,650-1,620 — key lower bounds that have held in recent pullbacks.
Intermediate pivot / trigger area: ~ ₹1,700-₹1,740 — if this area gives way, next leg down could accelerate; if it holds, potential bounce.
Weekly trend: The stock is below its 50- and 200-week moving averages, signalling caution for bulls.
Momentum: RSI in mid‐range, ADX weak, so trend strength is moderate.
Based on current weekly chart readings, recent pivot data and visible support/resistance zones:
Resistance zone: ~ ₹1,775-1,825 — price has been tested around this area, acting as a cap.
Support zone: ~ ₹1,650-1,620 — key lower bounds that have held in recent pullbacks.
Intermediate pivot / trigger area: ~ ₹1,700-₹1,740 — if this area gives way, next leg down could accelerate; if it holds, potential bounce.
Weekly trend: The stock is below its 50- and 200-week moving averages, signalling caution for bulls.
Momentum: RSI in mid‐range, ADX weak, so trend strength is moderate.
関連の投稿
免責事項
この情報および投稿は、TradingViewが提供または推奨する金融、投資、トレード、その他のアドバイスや推奨を意図するものではなく、それらを構成するものでもありません。詳細は利用規約をご覧ください。
関連の投稿
免責事項
この情報および投稿は、TradingViewが提供または推奨する金融、投資、トレード、その他のアドバイスや推奨を意図するものではなく、それらを構成するものでもありません。詳細は利用規約をご覧ください。