Pyramid Technoplast Ltd – Falling Trendline Breakout! 💥
📅 Date: April 8, 2025
📊 Chart Analysis:
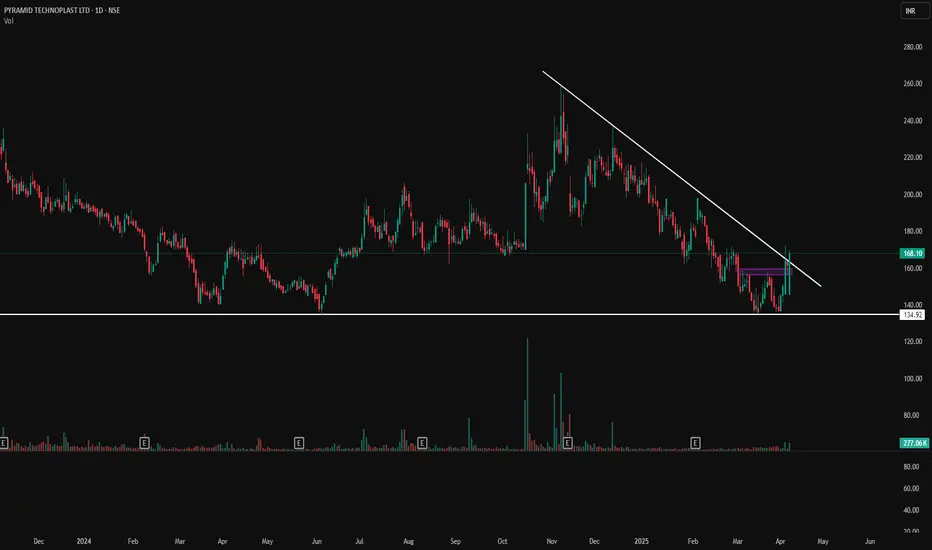
The stock has successfully broken out of a long-term falling trendline, indicating a potential reversal of the previous downtrend. This move is backed by strong bullish candles and an increase in volume.
📌 Key Levels:
📉 Major Support: ₹134.92
🔄 Previous Resistance/Flip Zone: ₹160-165 (now acting as support)
📈 Immediate Resistance Levels: ₹180, ₹195, ₹210
📈 Technical Indicators & Patterns:
Falling Trendline Breakout visible with strong bullish momentum.
Volume confirmation indicates institutional interest.
Price closing above ₹165 can lead to further upside.
🔍 Volume Insight:
Volume surged to 277K, which is significantly higher than the average, adding credibility to the breakout.
🚀 Potential Setup:
If price holds above ₹165–₹168, next targets could be ₹180 and ₹195.
Pullback toward ₹160–₹165 zone can be seen as a retest and buying opportunity.
📌 Disclaimer: This is for educational and analysis purposes only. Always consult your financial advisor before making investment decisions.
📅 Date: April 8, 2025
📊 Chart Analysis:
The stock has successfully broken out of a long-term falling trendline, indicating a potential reversal of the previous downtrend. This move is backed by strong bullish candles and an increase in volume.
📌 Key Levels:
📉 Major Support: ₹134.92
🔄 Previous Resistance/Flip Zone: ₹160-165 (now acting as support)
📈 Immediate Resistance Levels: ₹180, ₹195, ₹210
📈 Technical Indicators & Patterns:
Falling Trendline Breakout visible with strong bullish momentum.
Volume confirmation indicates institutional interest.
Price closing above ₹165 can lead to further upside.
🔍 Volume Insight:
Volume surged to 277K, which is significantly higher than the average, adding credibility to the breakout.
🚀 Potential Setup:
If price holds above ₹165–₹168, next targets could be ₹180 and ₹195.
Pullback toward ₹160–₹165 zone can be seen as a retest and buying opportunity.
📌 Disclaimer: This is for educational and analysis purposes only. Always consult your financial advisor before making investment decisions.
免責事項
これらの情報および投稿は、TradingViewが提供または保証する金融、投資、取引、またはその他の種類のアドバイスや推奨を意図したものではなく、またそのようなものでもありません。詳しくは利用規約をご覧ください。
免責事項
これらの情報および投稿は、TradingViewが提供または保証する金融、投資、取引、またはその他の種類のアドバイスや推奨を意図したものではなく、またそのようなものでもありません。詳しくは利用規約をご覧ください。