A gap occurs when the price opens significantly higher or lower than the prior close, leaving an empty space on the chart
1. Common Gap
2. Breakaway Gap
3. Runaway / Continuation Gap
4. Exhaustion Gap
Many gaps get “filled” (price trades back through the open-close range)
Gap up into resistance - fade (short-term sell bias)
Gap up out of consolidation - trend continuation
Gap down into support - bounce potential
Gap down breaking major support - momentum short
A big distance between prior close and next open (think 2%+ in QQQ, which is large for an index ETF) suggests a strong imbalance between buyers/sellers (news, macro shock, earnings, Fed, etc) & are often trend-driving (market re-prices & continues in that direction - breakaway or exhaustion)
Small difference between close & next open (<1% in QQQ) are common gaps that occur more often & tend to get filled quickly (1–5 sessions)
The small shaded areas around $560–$565 are narrow gaps which often act like magnets for price (easy “gap-fill” trades)
1. Wide Gaps are macro anchor levels
2. Narrow Gaps are short-term magnets
QQQ grinding against ATHs while narrow gaps remain unfilled shows momentum strength
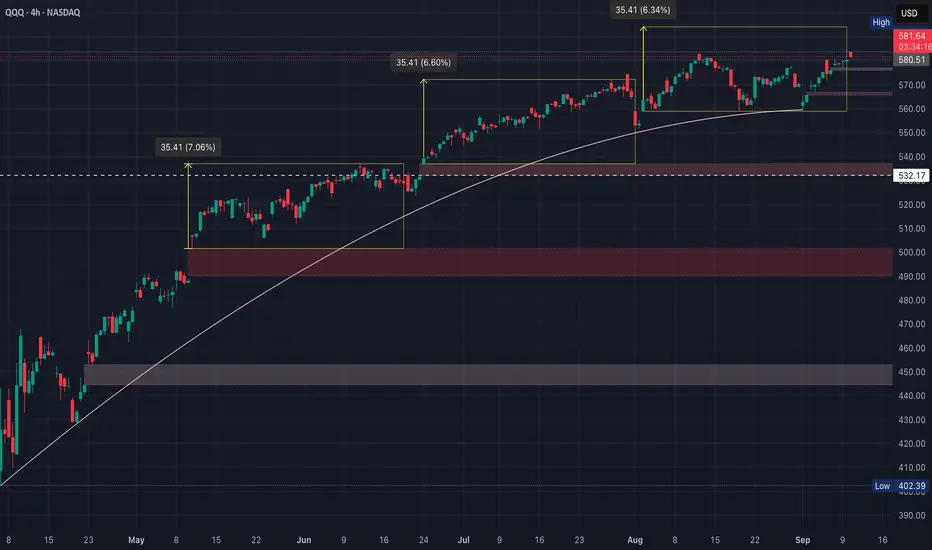
The curved trend line is the line in the sand
This symmetry is powerful since markets often move in measured waves
Equal legs can also signal a completed measured move
QQQ has rallied in 2 near-perfect measured moves of ~35 pts
1. March–May (early rally leg)
2. June–July (second impulse leg)
3. August–September (near ATHs)
Rising price + rising volume = strong trend
Rising price + falling volume = weak trend (risk of stall)
Falling price + rising volume = strong distribution
Falling price + falling volume = normal pullback (trend intact)
The grind into $580 looks more like rising price + flat/weak volume
The first leg (April–May) with big green volume spikes shows strong conviction, but the second leg (June–July) shows price rose on lighter, declining volume, continuation, but less conviction, while the current leg (August–September) shows muted volume while pressing ATHs
QQQ’s last two impulse legs were ~35 pts - the current one is tracing the same path
RSI pushed into overbought (70+) multiple times
Volume is muted & RSI is rising, but not overbought yet
1. Common Gap
- Small, often within a range
- Usually filled quickly (price comes back to close the gap)
2. Breakaway Gap
- Happens at the start of a new trend (up or down)
- Price usually does not fill quickly because it’s breaking out of a consolidation zone
3. Runaway / Continuation Gap
- Occurs in the middle of a strong trend
- Reinforces momentum, shows buyers/sellers rushing in
4. Exhaustion Gap
- Appears near the end of a move
- Often followed by reversal once the last buyers/sellers have entered
Many gaps get “filled” (price trades back through the open-close range)
- Notice the jump candles where price leaps higher without overlapping prior highs
- Those are mini-breakaway gaps on smaller timeframes
- Larger daily gaps (from overnight futures) show up around major inflection points (~$540 or ~$500 in past months) often get retested
Gap up into resistance - fade (short-term sell bias)
Gap up out of consolidation - trend continuation
Gap down into support - bounce potential
Gap down breaking major support - momentum short
A big distance between prior close and next open (think 2%+ in QQQ, which is large for an index ETF) suggests a strong imbalance between buyers/sellers (news, macro shock, earnings, Fed, etc) & are often trend-driving (market re-prices & continues in that direction - breakaway or exhaustion)
- Traders treat wide gaps as structural levels (price can revisit them weeks/months later)
- The big shaded area in April/May around $450–$500 are wide gaps that anchor market structure
Small difference between close & next open (<1% in QQQ) are common gaps that occur more often & tend to get filled quickly (1–5 sessions)
- Momentum traders don’t put much weight on them since they’re more noise than regime change
The small shaded areas around $560–$565 are narrow gaps which often act like magnets for price (easy “gap-fill” trades)
1. Wide Gaps are macro anchor levels
- They define “areas of importance” where institutions re-priced risk
- If price revisits then expect strong reaction (support or resistance)
- The wider gaps ($540s, $500s) are less likely to fill immediately, but if momentum cracks, they’re where the market would re-price
2. Narrow Gaps are short-term magnets
- They get filled often and quickly.
- More useful for tactical swing or intraday trading
- The narrow gap at $560–$565 suggests that if bulls fail at $580, this is the first “magnet” downside target
QQQ grinding against ATHs while narrow gaps remain unfilled shows momentum strength
- Market is ignoring short-term inefficiencies because buyers are in control
- If $580–$581 rejection holds, sellers will target the nearest narrow gaps first ($560–$565)
- Only if weakness compounds do we start eyeing the wider gaps lower ($540s to the $500s)
The curved trend line is the line in the sand
- Above = momentum grind
- Below = unwind toward gap fills
This symmetry is powerful since markets often move in measured waves
- If history repeats, the next breakout could target another +35 pts from the last base ($560–$565)
- That projects into $595–$600, aligning with psychological round-number resistance
Equal legs can also signal a completed measured move
- If momentum fails at $580–$581, this may be a double top, meaning trend is stretched
- In that case, downside would first target gap at $560–$565 & possibly the $532 wide gap if the trend breaks
QQQ has rallied in 2 near-perfect measured moves of ~35 pts
- A third move could carry it to $595–$600, but failing here suggests exhaustion
- The trend + gaps below tell us exactly where risk opens if $580 rejection plays out
1. March–May (early rally leg)
- Strong expansion in volume on the breakout from the base
- Classic sign of institutional accumulation
2. June–July (second impulse leg)
- Price kept making higher highs, but volume gradually tapered off
- That’s a hallmark of momentum continuation without fresh conviction
- It doesn’t kill the trend, but it does mean rallies are carried more by buyers stepping in on dips; rather than, aggressive new buying
3. August–September (near ATHs)
- Volume remains muted during the grind into $580–$581 resistance
- Price has lifted, but not on strong participation
- Suggests buyers are cautious & sellers haven’t pressed yet either (a “low energy” standoff)
Rising price + rising volume = strong trend
Rising price + falling volume = weak trend (risk of stall)
Falling price + rising volume = strong distribution
Falling price + falling volume = normal pullback (trend intact)
The grind into $580 looks more like rising price + flat/weak volume
- That tilts toward caution - bulls need a volume expansion to confirm breakout; otherwise, the market risks a “measured move exhaustion” & reverts to filling nearby gaps
The first leg (April–May) with big green volume spikes shows strong conviction, but the second leg (June–July) shows price rose on lighter, declining volume, continuation, but less conviction, while the current leg (August–September) shows muted volume while pressing ATHs
- This is rising price + flat/weak volume, a classic “grind-up” pattern
- It works until it doesn’t - meaning breakouts need fresh volume expansion to hold
QQQ’s last two impulse legs were ~35 pts - the current one is tracing the same path
- Volume, however, is lighter than on the first rally (momentum continuation, but less conviction)
- Breakout needs volume confirmation; otherwise, expect symmetry to mark exhaustion & pullback toward gaps
RSI pushed into overbought (70+) multiple times
- RSI is trending upward again, but still below prior peaks (~65 vs 70+)
- Shows positive momentum, but not full-strength
- RSI holding above 50 is bullish, but failure to reach overbought on a breakout attempt would be a warning of exhaustion
Volume is muted & RSI is rising, but not overbought yet
- It means the breakout is vulnerable without a volume surge & RSI follow-through
- RSI confirms buyers are pushing, but momentum is weaker than in the first impulse
- Breakout with RSI >70 is fuel to $595–$600; breakout with RSI divergence is likely a bull trap
I am not a licensed professional & these posts are for informational purposes only, not financial advice
免責事項
これらの情報および投稿は、TradingViewが提供または保証する金融、投資、取引、またはその他の種類のアドバイスや推奨を意図したものではなく、またそのようなものでもありません。詳しくは利用規約をご覧ください。
I am not a licensed professional & these posts are for informational purposes only, not financial advice
免責事項
これらの情報および投稿は、TradingViewが提供または保証する金融、投資、取引、またはその他の種類のアドバイスや推奨を意図したものではなく、またそのようなものでもありません。詳しくは利用規約をご覧ください。