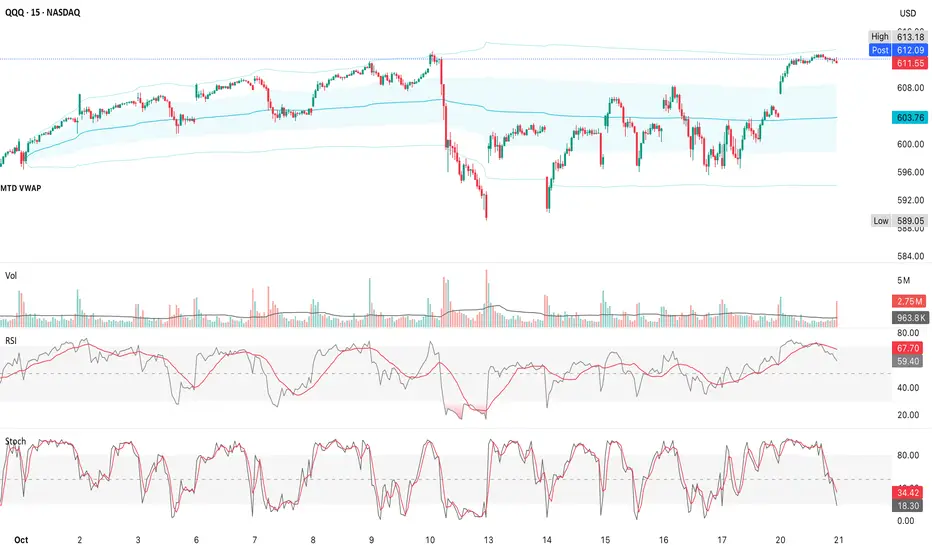
Short-term momentum is stretched so watch for a potential pullback to $608 then $603 if selling follows through
1. Price vs MTD VWAP
2. Volume Profile
3. RSI (15m)
RSI ≈ 68 & curling lower from overbought
4. Stochastic Oscillator
5. Intraday Structure
Start of wave a
Mid-wave a acceleration
End of wave a
Wave b "bounce"
Wave c

1. Price vs MTD VWAP
- MTD VWAP ≈ $603.7, with +1σ ≈ $611 & +2σ ≈ $613
- QQQ is pressing the upper (+2σ) edge of the VWAP envelope & that’s statistically extended
- Historically, price rarely sustains above this zone without cooling off toward +1σ ($608-$609) or the VWAP itself ($603-$604)
- Overbought short-term; risk of mean reversion if momentum fades
2. Volume Profile
- Volume into the close rose sharply, but without broad range expansion
- That kind of volume spike after an extended move often means distribution (profit-taking at highs) rather than fresh breakout energy
- The closing volume spike without strong follow-through suggests distribution (smart money selling into strength)
- That’s also characteristic of the transition from Wave 5 to wave a (meaning the first corrective down-leg may already be starting)
- Likely aiming for $588-$590 first & potentially $532 over the next 4-6 weeks if the full correction unfolds
3. RSI (15m)
RSI ≈ 68 & curling lower from overbought
- A bearish cross of RSI below its signal line after sitting near 70 is a classic short-term momentum-loss trigger
- Supports the idea of a pullback or consolidation within 1-2 sessions
4. Stochastic Oscillator
- Fast %K & %D have both rolled over sharply (≈ 34 & 18)
- Coming off multiple overbought resets above 80, this steep drop signals short-term exhaustion with traders locking gains
5. Intraday Structure
- You can see bearish divergence forming where price neared ATHs (~$613.18) while RSI & Stoch made lower highs
- That divergence plus rejection at +2σ VWAP = early topping behavior on the 15m timeframe
Start of wave a
- Post $613 tag
- Pullback to $608–$609
- +1σ VWAP support
Mid-wave a acceleration
- Next 1-2 sessions
- Sharp dip to $603-$604
- MTD VWAP mean
End of wave a
- Within ~3-5 days
- $588-$590
- Prior breakout base
Wave b "bounce"
- Late this or next week
- Rebound to $595-$600
- Lower high under prior peak
Wave c
- Following weeks
- Down to $540-$532
- 61.8% daily retracement
I am not a licensed professional & these posts are for informational purposes only, not financial advice.
免責事項
この情報および投稿は、TradingViewが提供または推奨する金融、投資、トレード、その他のアドバイスや推奨を意図するものではなく、それらを構成するものでもありません。詳細は利用規約をご覧ください。
I am not a licensed professional & these posts are for informational purposes only, not financial advice.
免責事項
この情報および投稿は、TradingViewが提供または推奨する金融、投資、トレード、その他のアドバイスや推奨を意図するものではなく、それらを構成するものでもありません。詳細は利用規約をご覧ください。