The current leg (mid-2025 onward) is the steepest recovery yet & that slope just broke
The red projection mimics the 2024 & mid-2023 patterns that featured a short distribution, decline & support at the previous breakout area
- This indicates a possible mean reversion phase rather than another leg up
- Steep advance > rounding top > 8-12% correction
- Then a multi-month basing period before recovery
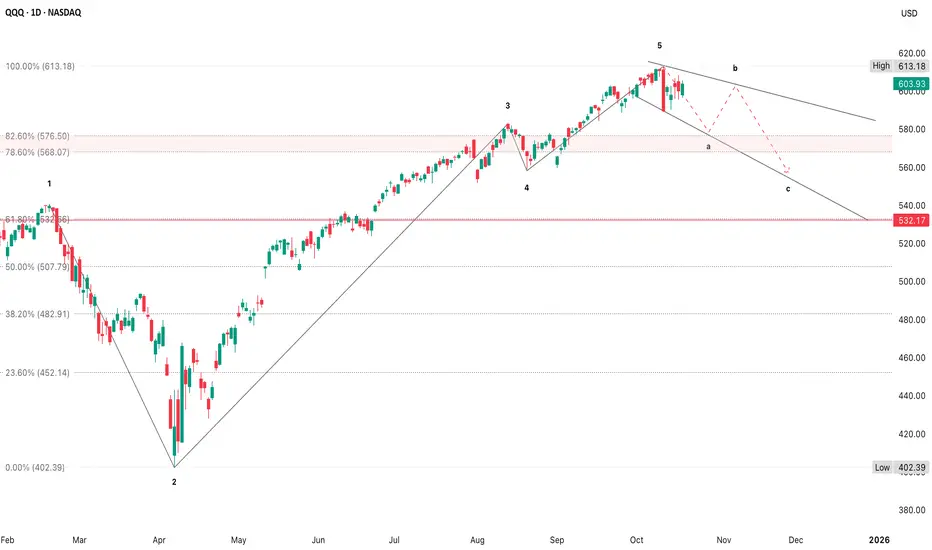
- If that rhythm repeats, the current topping area around $613 could imply a pullback to $560-$580
- That would be a “standard” correction, not a crisis
The red projection mimics the 2024 & mid-2023 patterns that featured a short distribution, decline & support at the previous breakout area
- The support shelf sits near $580-$585, where prior resistance turned support (June-July 2025)
- Below $575 would confirm a more durable trend break & that’s where longer-term funds start de-risking
- Large-scale corrections on this timeframe (daily, spanning 6-12 months) usually take 2-4 weeks to play out from first break to low, followed by a 1-3 week consolidation near the floor
- So if the current roll continues, your next decisive move window is late October into early November
- If you’re trading via options, it reinforces using 2-3 week puts since they align with both the short-term structure & this macro corrective window
トレード稼働中
The larger trend remains intact, with this being a consolidation within a primary uptrend• Wave B rally to approximately $615-$620
• Wave C decline to $560 ±10, likely finishing late November to early December
• As long as price stays below $623
I am not a licensed professional & these posts are for informational purposes only, not financial advice.
免責事項
この情報および投稿は、TradingViewが提供または推奨する金融、投資、トレード、その他のアドバイスや推奨を意図するものではなく、それらを構成するものでもありません。詳細は利用規約をご覧ください。
I am not a licensed professional & these posts are for informational purposes only, not financial advice.
免責事項
この情報および投稿は、TradingViewが提供または推奨する金融、投資、トレード、その他のアドバイスや推奨を意図するものではなく、それらを構成するものでもありません。詳細は利用規約をご覧ください。