The probability skew remains to the downside over the next 1-2 wks
±3% Envelope from Current Price ($603.93)
1. +3% ≈ $622
2. -3% ≈ $586.80
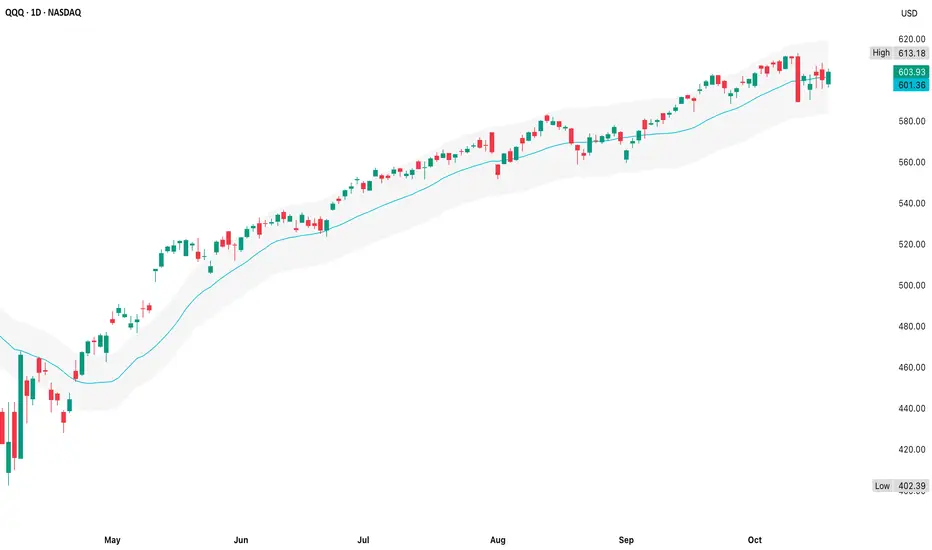
The daily chart shows QQQ trapped around its mean, with weakening upside participation - ideal environment for short-term bearish option plays (1-3 week window), but not yet a crash setup
The mean line around $601-$602 is acting as the pivot for now & price keeps oscillating right around it
- ±3% envelope = $622/$587
- Expect mean reversion near $601
- Technical confluence + implied vol suggest any break of $595 confirms a run toward the lower envelope (~$586-$590)
±3% Envelope from Current Price ($603.93)
1. +3% ≈ $622
- Top edge of the prior uptrend channel; retests the failed breakout zone from early October ($613-$620)
- Strong resistance cluster; unlikely to break unless mega-cap earnings crush expectations
2. -3% ≈ $586.80
- Perfect alignment with the measured-move support from the head & shoulders (~$585-$590)
- This is the “bear completion” area where shorts often take partial profits
The daily chart shows QQQ trapped around its mean, with weakening upside participation - ideal environment for short-term bearish option plays (1-3 week window), but not yet a crash setup
- If you close below $600 on volume, this likely triggers momentum algos for a retest of $592
- If you close above $607 with breadth confirmation, you’ll get a squeeze, but probably short-lived without macro support
The mean line around $601-$602 is acting as the pivot for now & price keeps oscillating right around it
- You’ve got 2 failed highs in early & mid-October, that’s consistent with a rolling top
- The candle bodies are hugging the lower half of the volatility band rather than the upper which is a subtle shift in momentum
- RSI (4H view) is still under 55 with no true momentum reclaim
- So despite the bounce Friday, it’s technically still corrective inside an uptrend, not fresh bullish
- This kind of daily structure with a slow drift near the mean with room to test lower band usually plays out over 1½-2 weeks before a directional break
- That again points to 10 to 21d options as the sweet spot since it's enough time for confirmation, short enough to keep theta manageable
I am not a licensed professional & these posts are for informational purposes only, not financial advice
免責事項
これらの情報および投稿は、TradingViewが提供または保証する金融、投資、取引、またはその他の種類のアドバイスや推奨を意図したものではなく、またそのようなものでもありません。詳しくは利用規約をご覧ください。
I am not a licensed professional & these posts are for informational purposes only, not financial advice
免責事項
これらの情報および投稿は、TradingViewが提供または保証する金融、投資、取引、またはその他の種類のアドバイスや推奨を意図したものではなく、またそのようなものでもありません。詳しくは利用規約をご覧ください。