QQQ is gapping down right into a massive technical test: the $593 Gap Support.
This is not a regular drop. Our chart is showing a rare conflict:
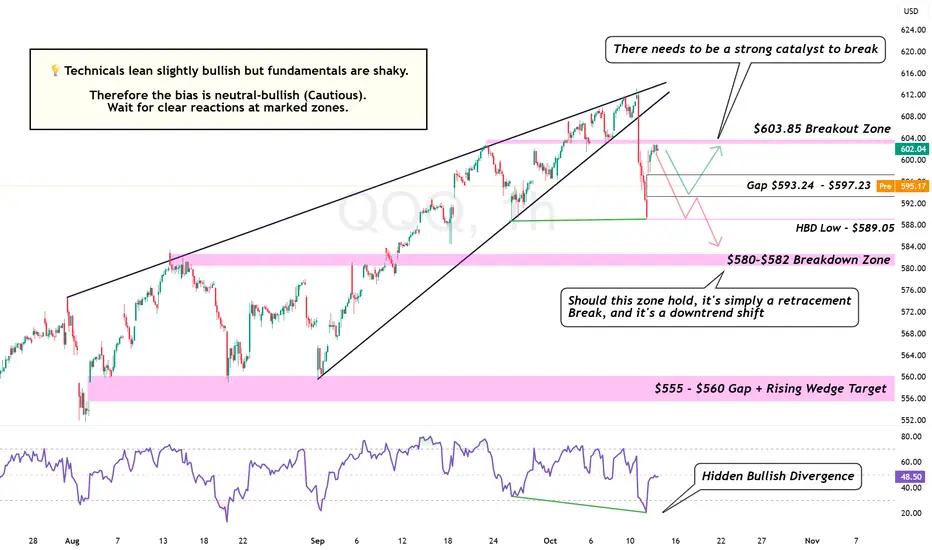
The bias right now is neutral-bullish — cautious optimism.
If bulls hold the gap, expect a short-term rebound toward $603–$605 where sellers will likely re-emerge.
But if $593 gives way, this turns into a full-on correction targeting $582 → $560, completing the wedge breakdown target.
Key Levels:
Bias: 🟡 Neutral-Bullish (Cautious)
Timeframe: 1H
Indicators: RSI Hidden Bullish Divergence, Rising Wedge Breakdown
This is not a regular drop. Our chart is showing a rare conflict:
- Bullish Setup: A Hidden Bullish Divergence (HBD) is screaming for a bounce.
- Bearish Risk: A loss of the low could trigger a rapid descent to the $580 Zone.
The bias right now is neutral-bullish — cautious optimism.
If bulls hold the gap, expect a short-term rebound toward $603–$605 where sellers will likely re-emerge.
But if $593 gives way, this turns into a full-on correction targeting $582 → $560, completing the wedge breakdown target.
This is the moment of truth.
Bulls need to defend $593 or risk a complete sentiment shift.
Key Levels:
- $603.85 — Breakout Zone
- $593.24–$597.23 — Gap Support
- $589.05 — Structural Floor
- $580–$582 — Breakdown Zone
- $555–$560 — Rising Wedge Target
Bias: 🟡 Neutral-Bullish (Cautious)
Timeframe: 1H
Indicators: RSI Hidden Bullish Divergence, Rising Wedge Breakdown
Trading leveraged products carries a high level of risk and may result in losses exceeding your initial investment; ensure you fully understand the risks involved.
-
Use your TradingView charts to trade your Alchemy account: bit.ly/42vUfjL
-
Use your TradingView charts to trade your Alchemy account: bit.ly/42vUfjL
免責事項
これらの情報および投稿は、TradingViewが提供または保証する金融、投資、取引、またはその他の種類のアドバイスや推奨を意図したものではなく、またそのようなものでもありません。詳しくは利用規約をご覧ください。