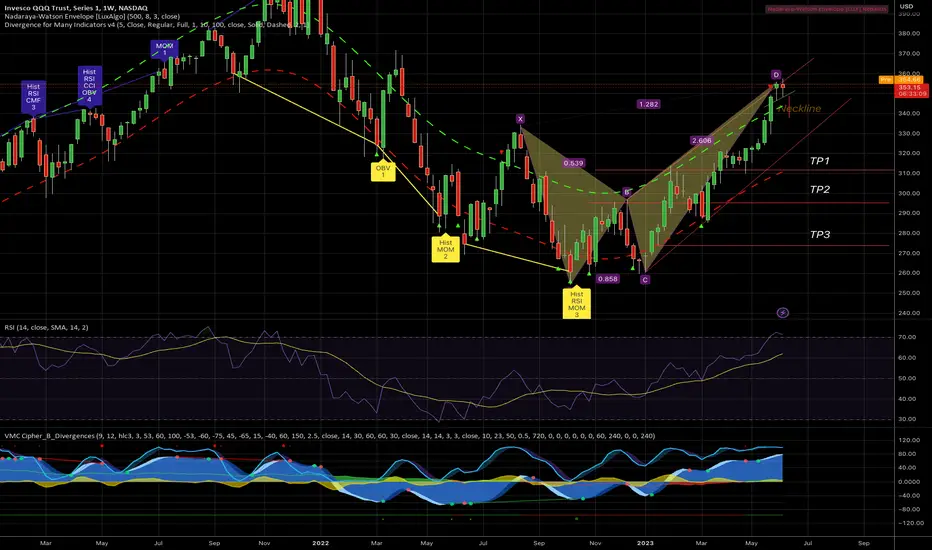
The QQQs have created a head & shoulders pattern now and In the chart, you can see that we have a butterfly-bearish pattern.
For short-term target head and shoulder measurement move the target to 340$
We have a rising wedge pattern when the price breaks the support line of the rising wedge:
1st Target around 310$
2nd Target around 300$
3rd Target around 275$
I guess the price gonna drop to 330 before the FED meeting on the 13th of June.
I'm not a financial advisor.
ノート
On 45 min graph, we can see a head and shoulder, a double top pattern, and a 7 bearish confirmation to the downsideノート
A double top pattern, and a 7 bearish waiting for the neckline to break 
注文をキャンセル
免責事項
これらの情報および投稿は、TradingViewが提供または保証する金融、投資、取引、またはその他の種類のアドバイスや推奨を意図したものではなく、またそのようなものでもありません。詳しくは利用規約をご覧ください。
免責事項
これらの情報および投稿は、TradingViewが提供または保証する金融、投資、取引、またはその他の種類のアドバイスや推奨を意図したものではなく、またそのようなものでもありません。詳しくは利用規約をご覧ください。