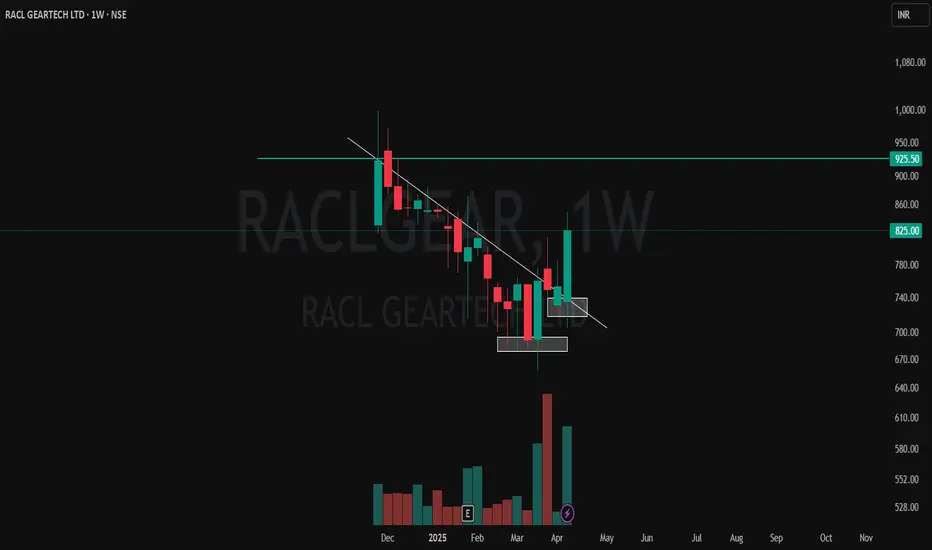
✅ White Line: Represents a well-respected CT trendline — multiple touches before finally getting broken with conviction.
✅ Volume Breakout: Strong volume spike confirms the breakout — classic case of price and volume moving in sync.
✅ White Zones: Marking clear Higher Low formations — price respecting structure before launching up.
✅ Green-Cyan Line: Marks a multi-timeframe supply zone. This level will be critical for continuation or rejection watch.
Structure, volume, and context are lining up — keeping this one on radar for further price action development. 📊
🎯 Master My Self-Made Trading Strategy
📈 Telegram (Learn Today): t.me/hashtaghammer
✅ WhatsApp (Learn Today): wa.me/919455664601
📈 Telegram (Learn Today): t.me/hashtaghammer
✅ WhatsApp (Learn Today): wa.me/919455664601
関連の投稿
免責事項
この情報および投稿は、TradingViewが提供または推奨する金融、投資、トレード、その他のアドバイスや推奨を意図するものではなく、それらを構成するものでもありません。詳細は利用規約をご覧ください。