Rashtriya Chemicals and Fertilizers Limited (RCF) has formed a bullish chart pattern called Head and Shoulder. Chart structure is bullish in every point of views like in a daily chart pattern you found RSI above 60 and also above 200 EMA is a very positive signal of uptrend.
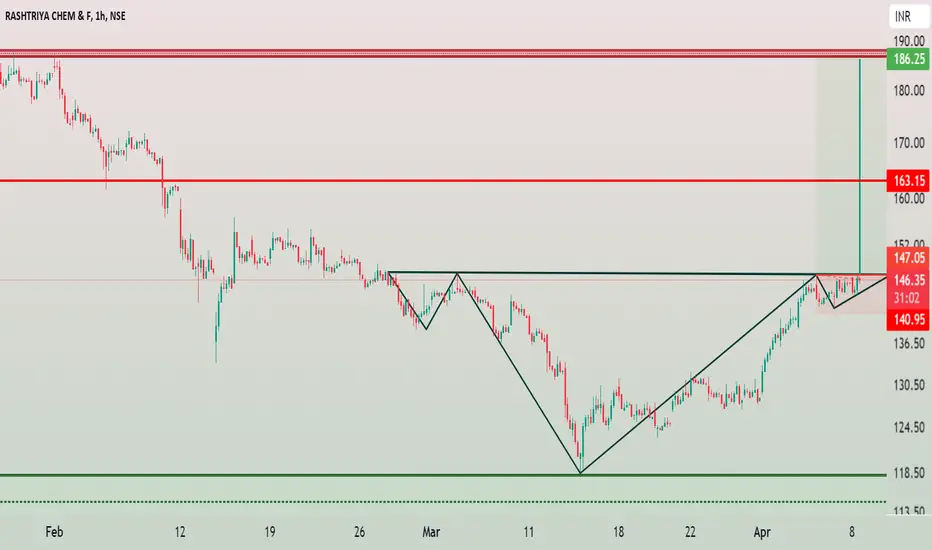
Head is formed at very important zone which act as a resistance for than a decade almost (14 years). After successfully breakout of important resistance now price retest that level and formed strongest support zone with bullish piercing candlestick in daily timeframe. Change of Polarity, Prior resistance become support.
RCF buy above 148
Stop Loss below 142
Target 163 and 186
免責事項
この情報および投稿は、TradingViewが提供または推奨する金融、投資、トレード、その他のアドバイスや推奨を意図するものではなく、それらを構成するものでもありません。詳細は利用規約をご覧ください。
免責事項
この情報および投稿は、TradingViewが提供または推奨する金融、投資、トレード、その他のアドバイスや推奨を意図するものではなく、それらを構成するものでもありません。詳細は利用規約をご覧ください。