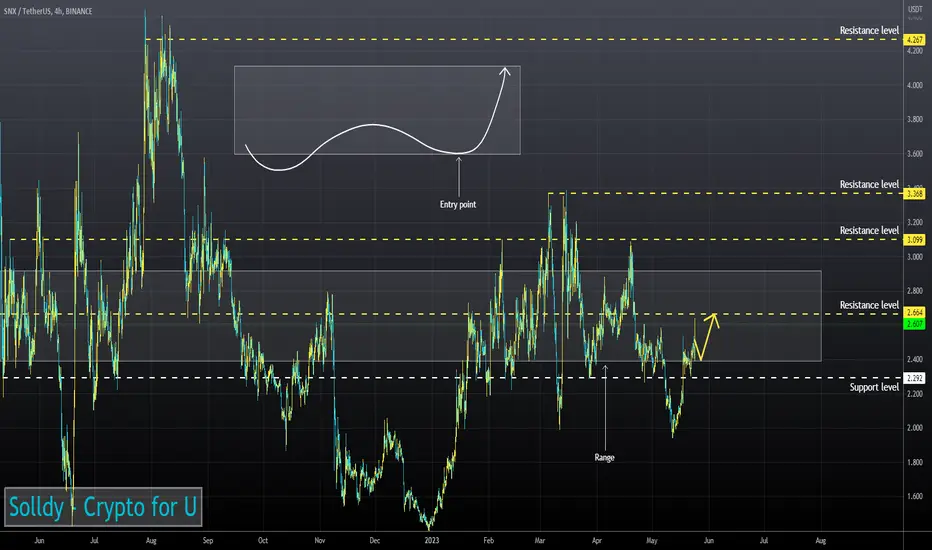
The SNX is back in the liquidity zone.
The RSI chart is moving in the buy zone (4H, 1H and 30m TFs).
50EMA has broken up 200EMA on the 4H Timeframe.
Price has fixed above 50EMA on the 1H Timeframe.
I believe the asset will continue to rise after holding the lower range boundary.
The RSI chart is moving in the buy zone (4H, 1H and 30m TFs).
50EMA has broken up 200EMA on the 4H Timeframe.
Price has fixed above 50EMA on the 1H Timeframe.
I believe the asset will continue to rise after holding the lower range boundary.
免責事項
これらの情報および投稿は、TradingViewが提供または保証する金融、投資、取引、またはその他の種類のアドバイスや推奨を意図したものではなく、またそのようなものでもありません。詳しくは利用規約をご覧ください。
免責事項
これらの情報および投稿は、TradingViewが提供または保証する金融、投資、取引、またはその他の種類のアドバイスや推奨を意図したものではなく、またそのようなものでもありません。詳しくは利用規約をご覧ください。